
What 81,000 people told us about the economics of AI
Anthropic опросила 81 000 пользователей Claude об экономических эффектах ИИ и связала их ответы с реальными паттернами использования из Economic Index. Около 20% респондентов опасаются вытеснения с работы, причём тревога выше среди тех, чьи профессии сильнее подвержены автоматизации (по метрике observed exposure), и среди работников в начале карьеры. Средняя оценка прироста продуктивности составила 5,1 из 7 («существенно продуктивнее»), наибольшие выгоды получили высокооплачиваемые специалисты (разработчики, менеджеры-предприниматели) и часть низкооплачиваемых работников. Самый частый источник прироста — расширение круга задач (scope, 48%), затем скорость (40%). Связь между ускорением и страхом потери работы — U-образная: тревожатся как те, кого ИИ замедляет (художники, писатели), так и те, кто получает наибольшее ускорение. Только 60% работников в начале карьеры говорят, что выгоды достаются им лично, против 80% среди senior-специалистов.
Что 81 000 человек рассказали нам об экономике ИИ

Ключевые выводы:
Наш недавний опрос 81 000 пользователей Claude показывает, что люди, работающие в ролях с большей подверженностью ИИ, сильнее обеспокоены вытеснением с работы из-за ИИ. Эти опасения также выше среди респондентов на ранних этапах карьеры.Работники в самых высокооплачиваемых и самых низкооплачиваемых профессиях сообщают о наибольшем приросте продуктивности — чаще всего за счёт расширения круга задач (выполнения новых задач).Респонденты, испытывающие наибольшее ускорение работы благодаря ИИ, выражают более высокую обеспокоенность вытеснением с работы.
Чтобы информировать общественность об экономических изменениях, которые мы наблюдаем в связи с ИИ, наш Economic Index рассказывает, какую работу просят выполнять Claude и в каких профессиях Claude делает наибольшую долю задач. Однако до сих пор нам не хватало данных о том, как эти паттерны использования соотносятся с мыслями и впечатлениями людей об ИИ.
Наше недавнее опросное исследование с участием 81 000 пользователей Claude позволяет связать экономические опасения людей с тем, что мы количественно измерили в трафике Claude.
Опрос задавал людям вопросы об их видениях и страхах относительно прогресса в ИИ. Многие мысли, которыми поделились респонденты, касались экономических тем. Мы узнали, что многие боятся потери работы — хотя они также чувствуют себя более продуктивными и наделёнными возможностями на работе. В одних случаях ИИ позволил им запустить бизнес или освободил время для более важных вещей; в других — ИИ ощущается как нечто сковывающее или навязанное работодателем.
Результаты опроса дают первые свидетельства того, что observed exposure (наша мера риска вытеснения ИИ) коррелирует с экономической тревогой вокруг ИИ. Люди в профессиях с высокой подверженностью — определяемых по задачам, которые выполняет Claude, — больше нервничали по поводу экономического вытеснения. Это согласуется с тем, что люди в целом осознают распространение ИИ и его возможные последствия. Ниже мы подробнее раскрываем наши выводы.
Кто беспокоится о потере работы?
«Ну, как и любой человек с офисной работой в наше время, я обеспокоен на 100%, практически 24/7, что в конечном счёте потеряю работу из-за ИИ». — Инженер-программист.1
Пятая часть респондентов нашего опроса выразила обеспокоенность экономическим вытеснением. Некоторые беспокоились абстрактно: один разработчик предостерёг от «возможности того, что ИИ в его нынешнем виде будет использоваться для замены младших позиций». Другие сетовали, что их работа или её отдельные аспекты автоматизируются. Один маркетинговый исследователь сказал: «С точки зрения улучшения моих возможностей — без сомнений. Но в будущем ИИ может заменить мою работу». В некоторых профессиях люди чувствовали, что ИИ усложняет их работу. Один разработчик заметил: «Когда появился ИИ, проджект-менеджеры начали выдавать всё более сложные тикеты и баги для решения».
На протяжении всего этого отчёта мы используем классификаторы на базе Claude, чтобы выводить характеристики и настроения людей из их ответов. Например, многие участники мимоходом упоминают свой род занятий или дают информативные детали о своей работе, что позволяет нам определить их профессию. Аналогично, мы количественно измеряем опасения по поводу потери работы, поручая Claude находить и интерпретировать прямые цитаты, в которых респонденты указывают, что их собственной роли угрожает вытеснение ИИ. Примеры промптов мы приводим в Приложении.
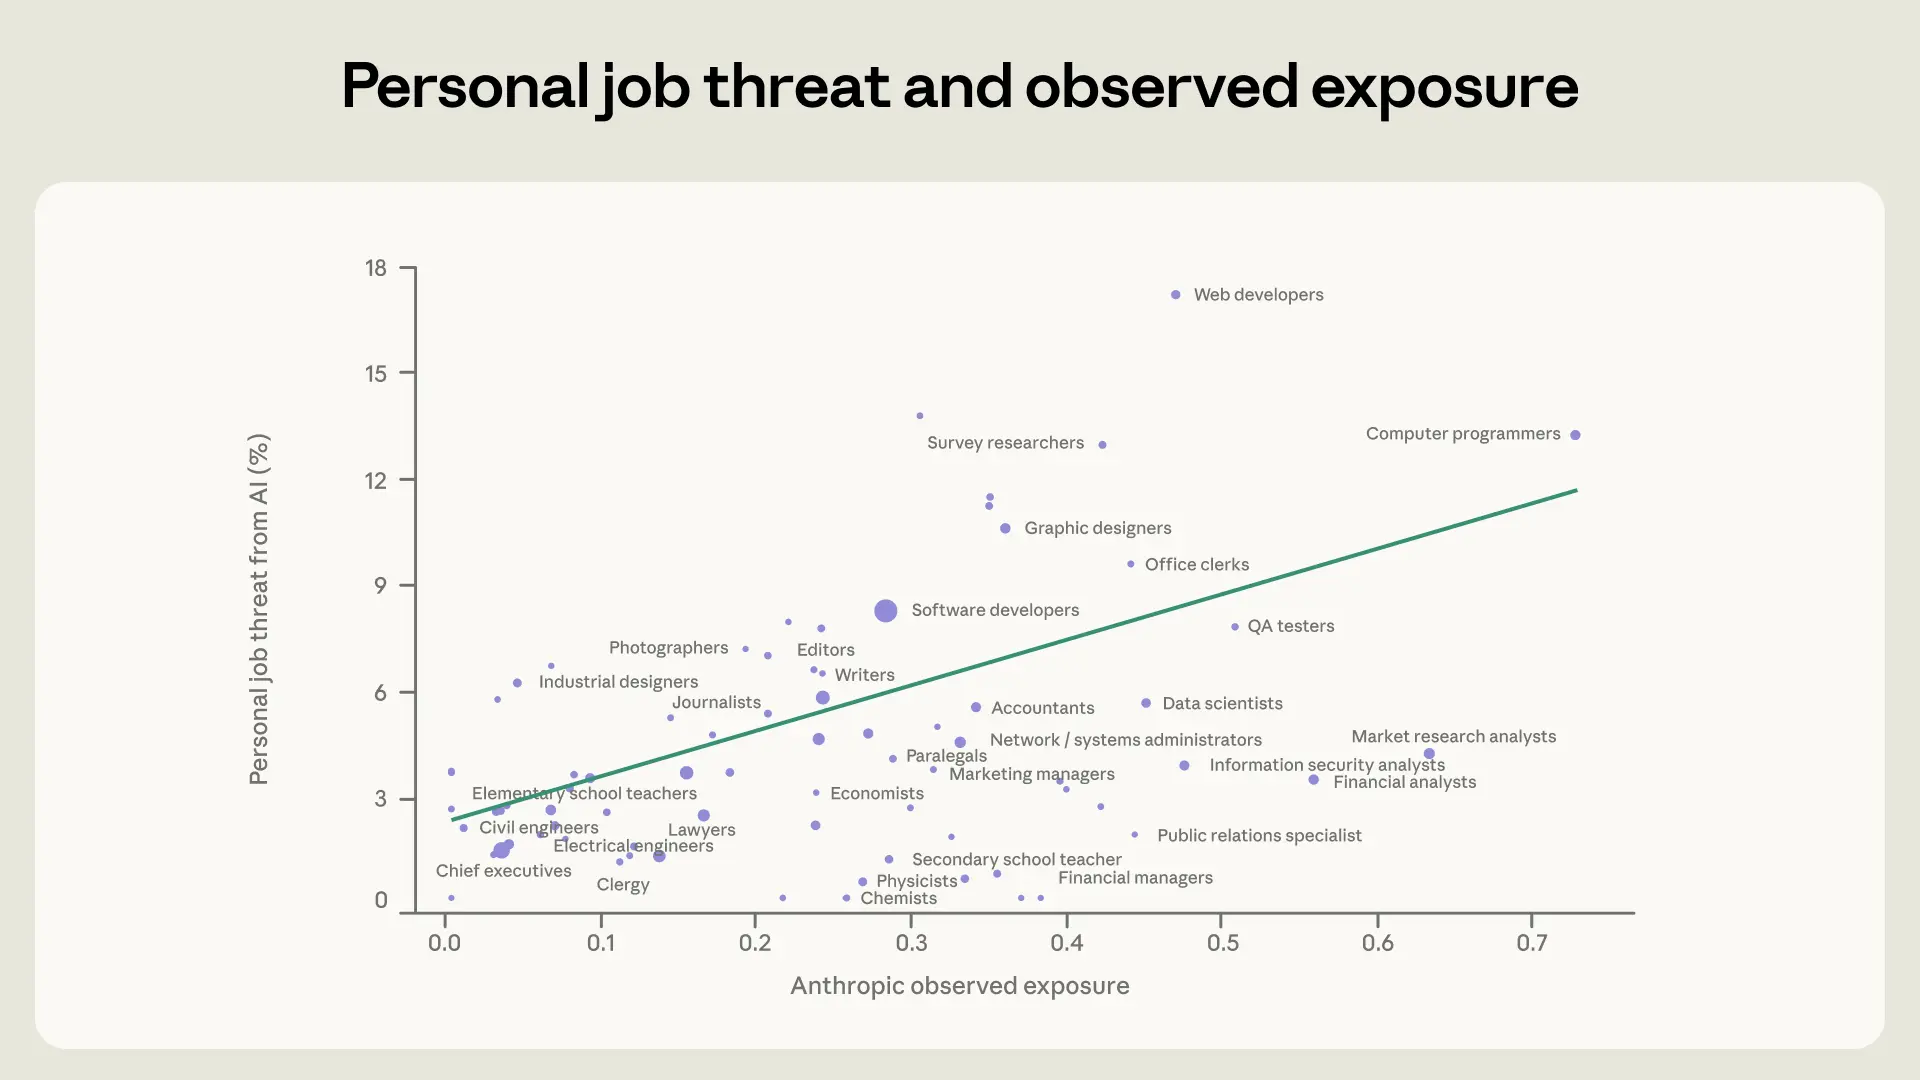
Воспринимаемая респондентами угроза со стороны ИИ коррелировала с нашей собственной мерой observed exposure, которая отражает процент задач в профессии, для решения которых используется Claude. Респондент был более обеспокоен ИИ, если наш показатель observed exposure для него был выше. Учителя начальных классов, например, меньше беспокоились о собственном вытеснении, чем инженеры-программисты, что согласуется с тем фактом, что использование Claude смещено в сторону задач по программированию.
Мы показываем это на Рисунке 1 ниже. По оси Y — процент респондентов в данной профессии, заявивших, что ИИ уже заменяет их роль или, вероятно, сделает это вскоре. По оси X — observed exposure. График показывает, что в среднем люди в профессиях с большей подверженностью склонны чаще выражать обеспокоенность по поводу автоматизации своей работы. На каждое увеличение подверженности на 10 процентных пунктов воспринимаемая угроза работе возрастала на 1,3 процентных пункта. Люди в верхних 25% по подверженности упоминали эту тревогу в три раза чаще, чем люди в нижних 25%.
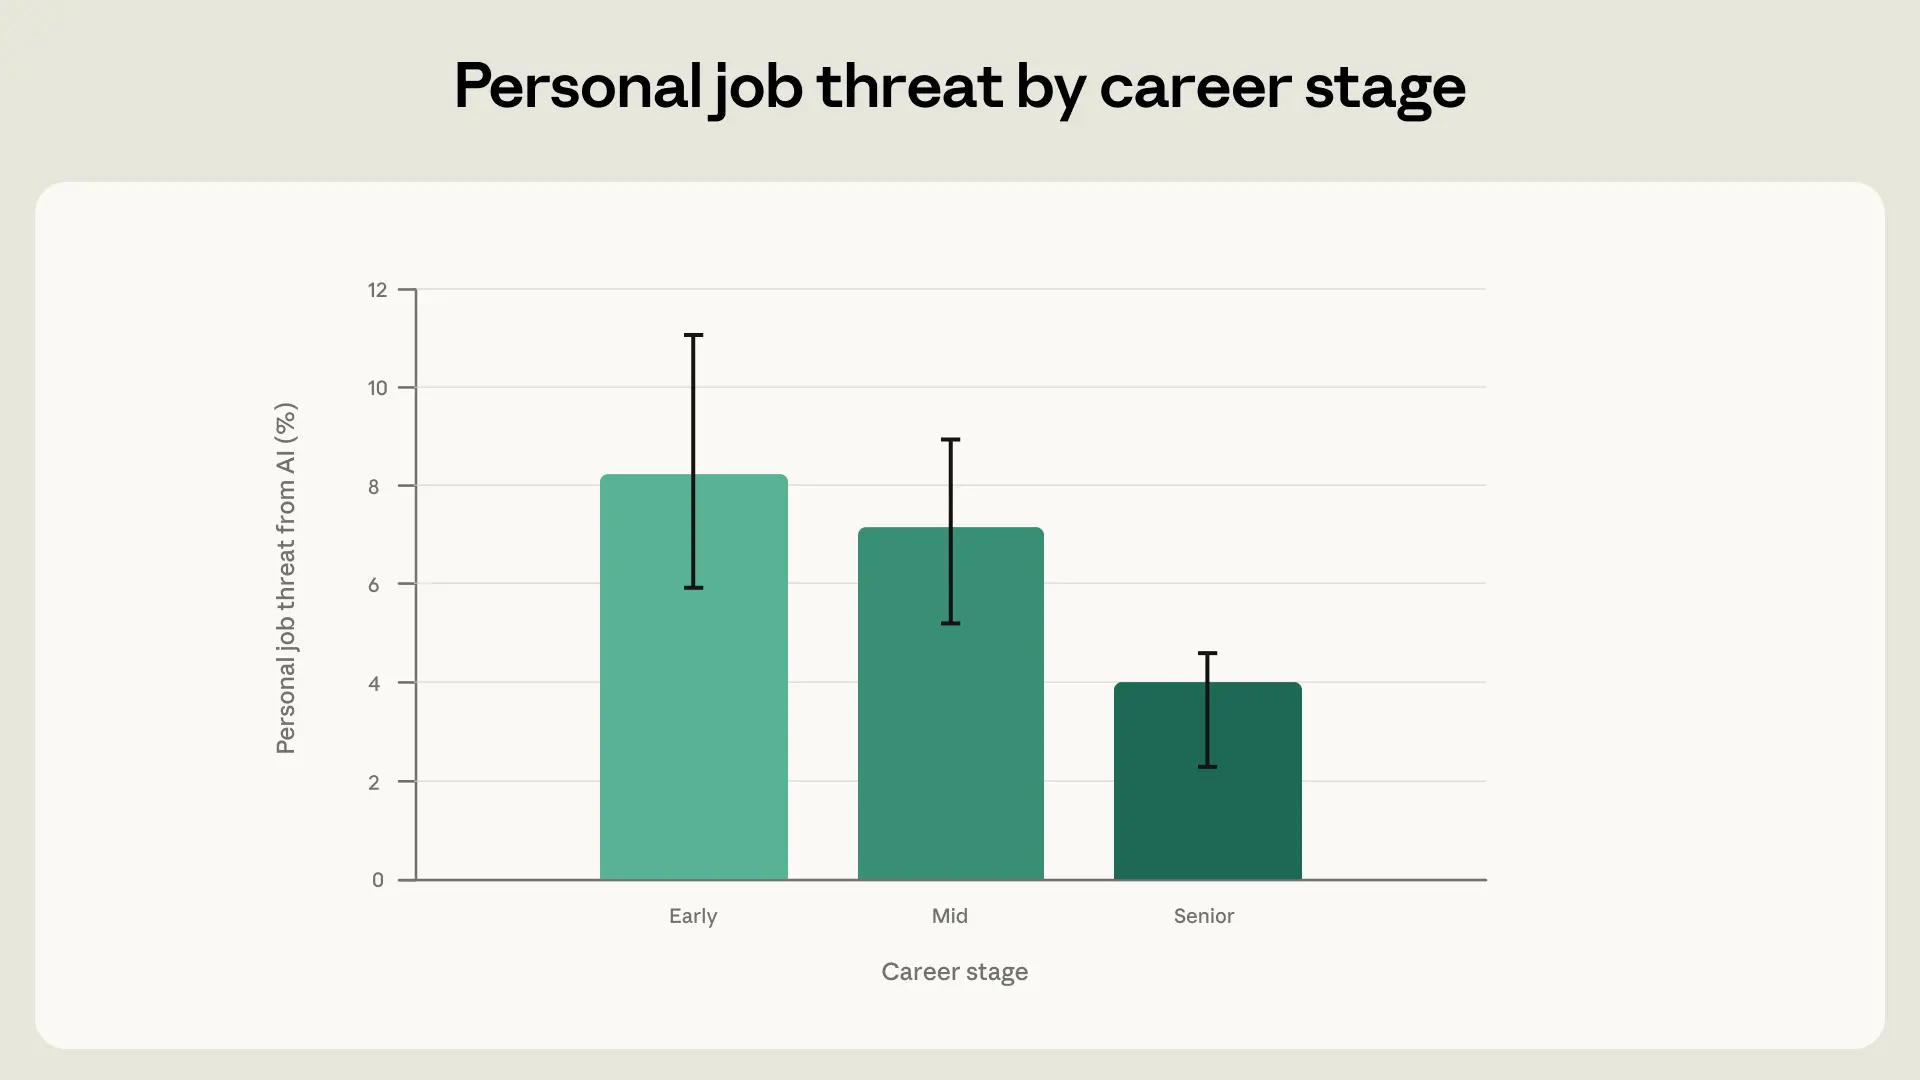
Ещё одной важной характеристикой работника является этап карьеры. В предыдущем исследовании мы сообщали о предварительных признаках замедления найма недавних выпускников и работников на ранних этапах карьеры в США. Примерно для половины респондентов этого опроса мы смогли вывести этап карьеры из их ответов.2 Мы обнаружили, что респонденты на ранних этапах карьеры гораздо чаще выражали обеспокоенность вытеснением с работы, чем старшие специалисты.
Кому выгоден ИИ?
Используя Claude для оценки ответов опроса, мы оценивали степень самоотчётного прироста продуктивности от ИИ по шкале от 1 до 7, где 1 — «менее продуктивен», 2 — «без изменений», а каждый последующий уровень означает больший прирост. Ответы, получившие 7, включали отзывы вроде: «Раньше уходили месяцы на создание сайта, который я [сделал] за 4–5 дней»; Claude ставил 5 за высказывания типа: «То, что могло бы занять четыре часа, было сделано за половину этого времени», и 2 за фразы вроде: «Лично мне ИИ помог исправить код на сайте. Но потребовалось несколько подходов, чтобы получить нужный результат».3
В целом люди в среднем сообщали о значимом приросте продуктивности. Средняя оценка продуктивности составила 5,1, что соответствует «существенно продуктивнее». Наши респонденты, разумеется, были активными пользователями Claude, согласившимися пройти опрос. Это может делать их более склонными сообщать о выгодах в продуктивности, чем средний пользователь. Около 3% сообщили об отрицательных или нейтральных эффектах, а 42% не дали чёткого указания на продуктивность.
Это в некоторой степени разделяется по уровню дохода. Левая панель Рисунка 3 показывает, что люди на высокооплачиваемых работах, например разработчики ПО, сообщали о наибольшем приросте продуктивности от ИИ. Этот результат обусловлен не только программированием; он сохраняется и при исключении профессий из сферы вычислений и математики. Это перекликается с предыдущим выводом Economic Index, также благоприятствовавшим более высокооплачиваемым работникам: в задачах, требующих более высокого уровня образования, Claude обычно сокращал время выполнения задачи (по сравнению с её выполнением без ИИ) на больший процент.
Часть самых низкооплачиваемых работников также описывает высокий прирост продуктивности. Это включало представителя клиентской поддержки, использовавшего «ИИ, чтобы сэкономить много времени на создании ответа на основе другого ответа». А в некоторых случаях люди на низкооплачиваемых работах использовали ИИ для технических побочных проектов. Один водитель доставки, например, использовал Claude, чтобы запустить e-commerce-бизнес, а ландшафтный дизайнер строил музыкальное приложение.
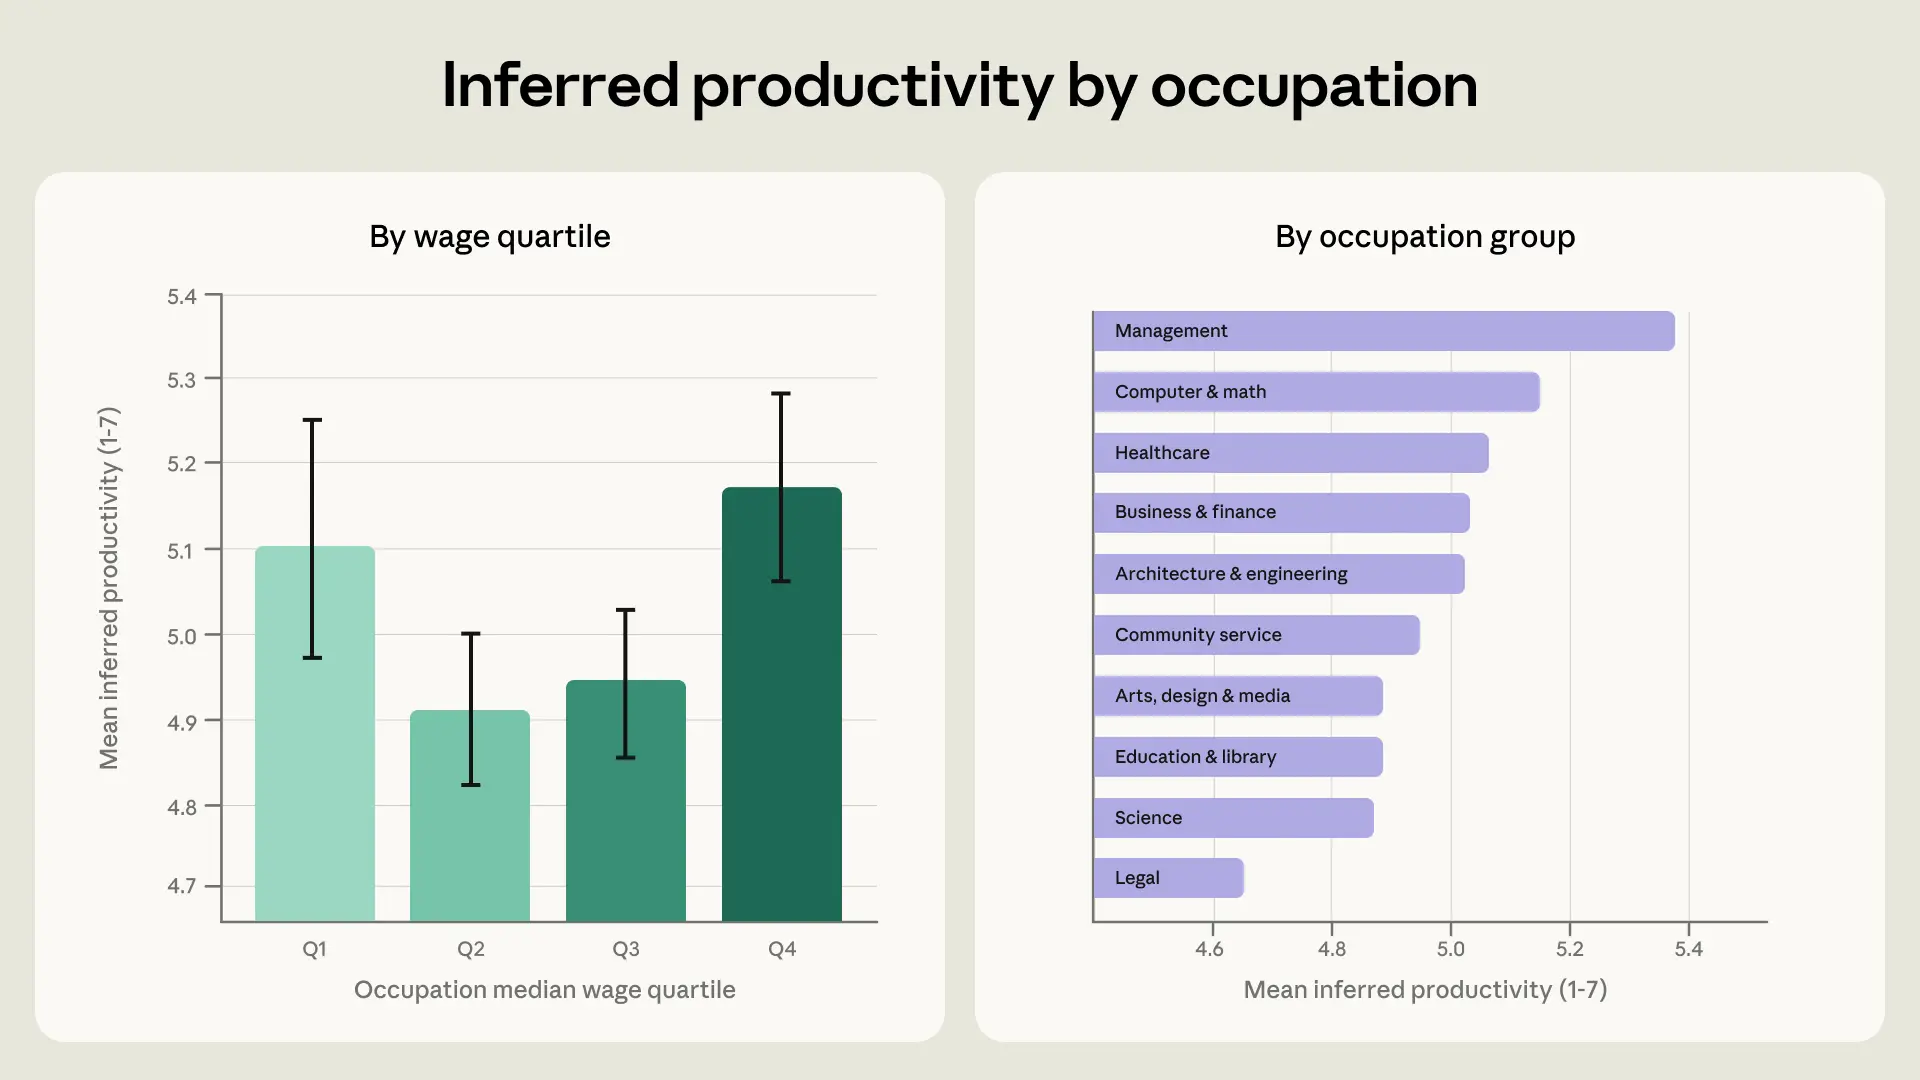
Мы рассматриваем это подробнее в правой панели Рисунка 3, показывая выведенный прирост продуктивности по основным профессиональным группам. Наверху — управленческие профессии. Эти респонденты — в основном предприниматели, использующие Claude для построения бизнеса.4 Следующая по величине категория — вычисления и математика, куда входят разработчики ПО. Две группы, демонстрирующие наиболее скромное улучшение продуктивности, — это работники научных и юридических профессий. Некоторые юристы беспокоились о способности ИИ следовать точным инструкциям. Например: «Я давал очень конкретные правила о том, что где находится, как читать юридический документ, что я хочу, чтобы он сделал… но он каждый раз отклоняется».
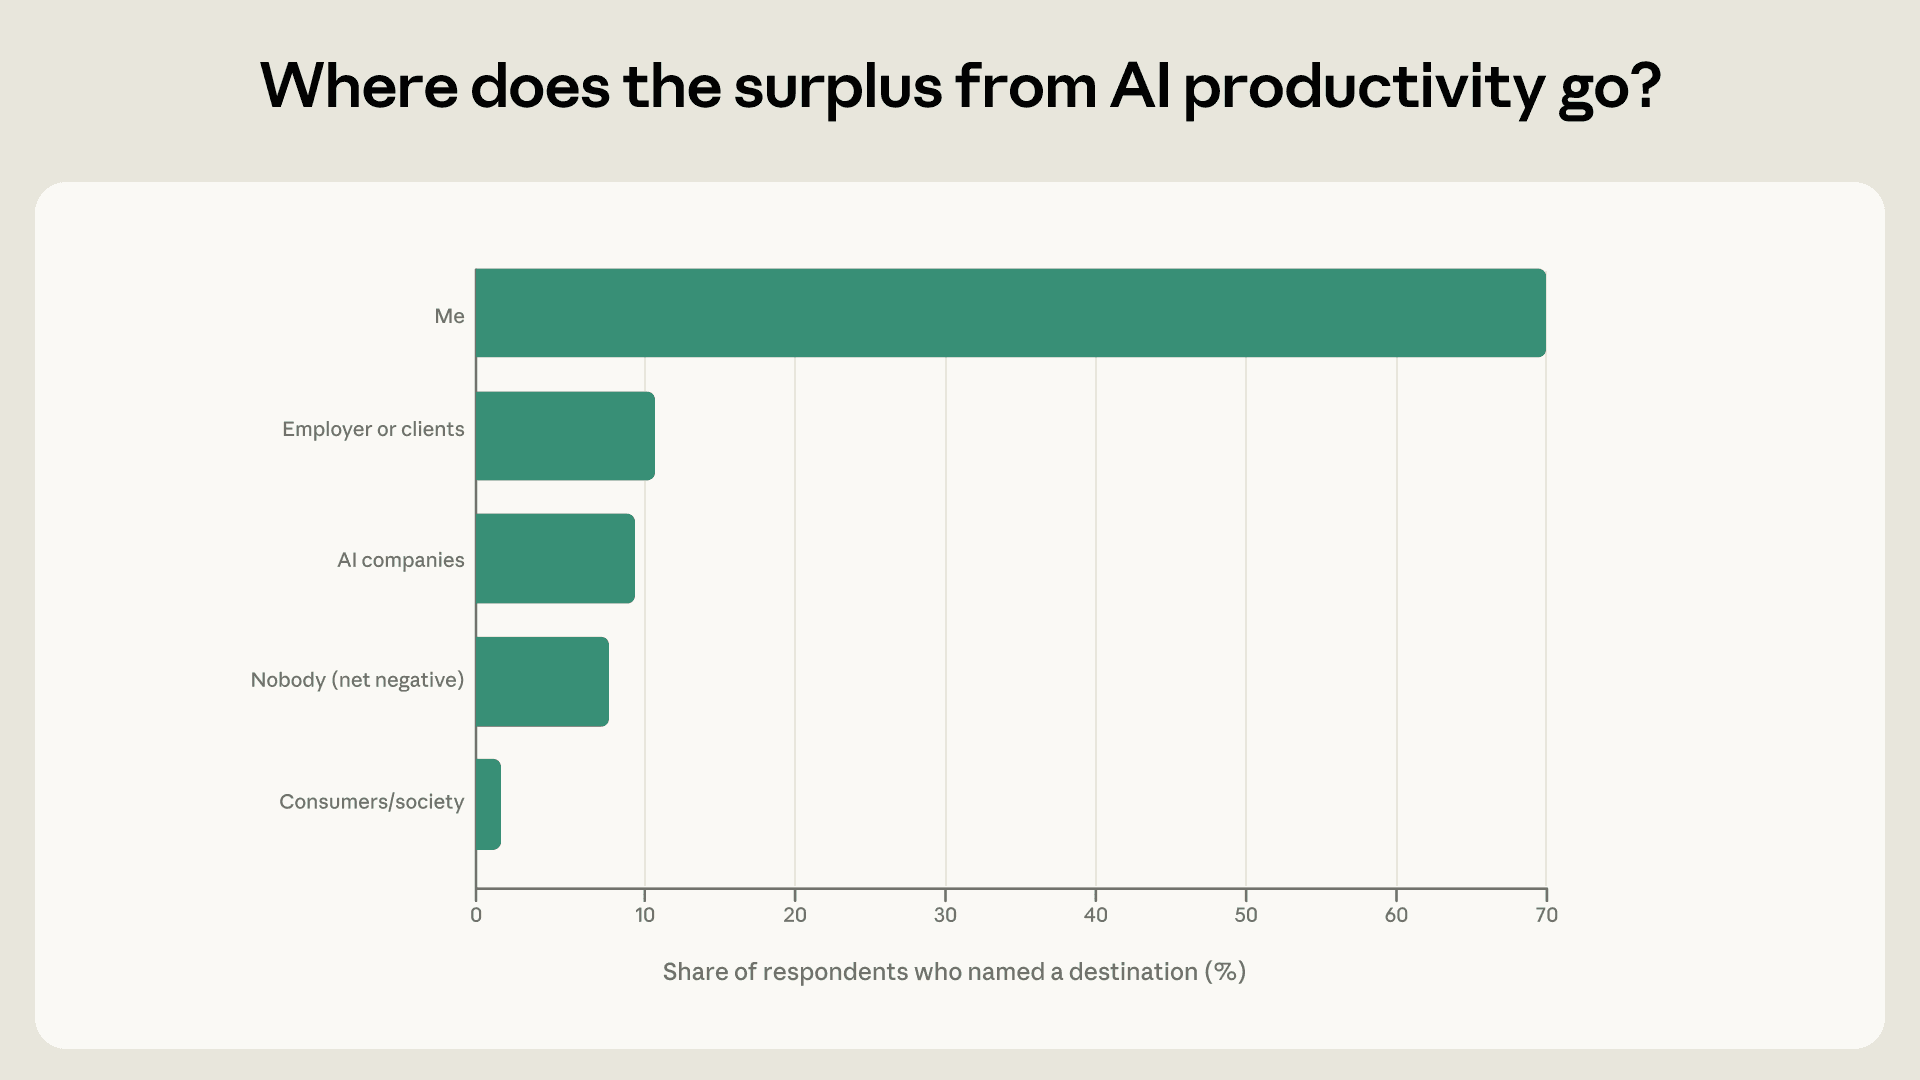
Ключевой вопрос по мере распространения ИИ в экономике — где будут аккумулироваться выгоды: у работников, их менеджеров, потребителей или корпораций. Респонденты указывали получателя этих выгод примерно в четверти интервью. В целом большинство этих людей называли выгоды для самих себя — через ускорение задач, расширение круга обязанностей и освобождение времени.5 Но 10% респондентов, назвавших получателя, сказали, что работодатели или клиенты требуют и получают больше работы. Меньшая доля упоминала выгоды для ИИ-компаний, и ещё меньшая — что ИИ окажется чистым минусом. Это зависело от этапа карьеры: лишь 60% работников на ранних этапах карьеры указали, что лично получили выгоду от ИИ, по сравнению с 80% старших специалистов.
Круг задач и скорость
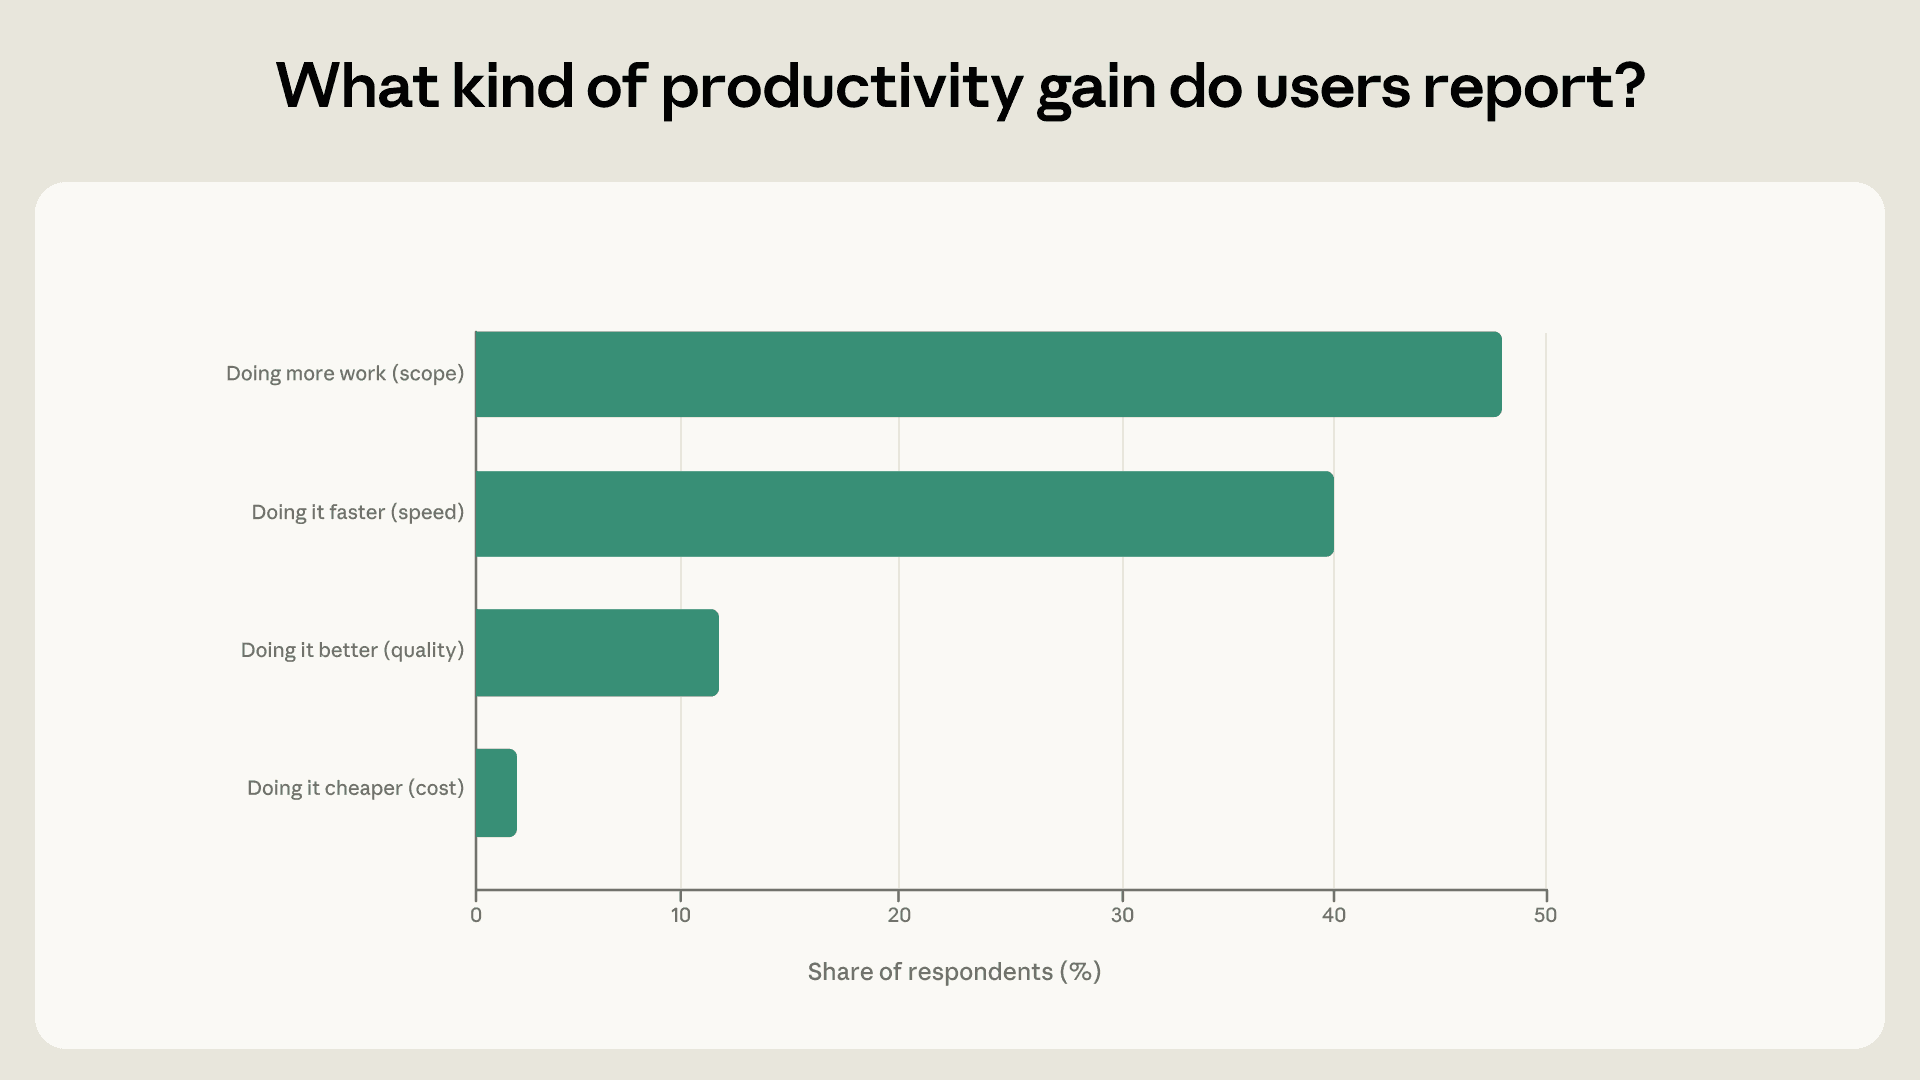
Респонденты также делились тем, в чём именно они получили прирост продуктивности. Мы разделяем это на круг задач (scope), скорость, качество и стоимость. Например, многие, использующие ИИ для задач программирования, говорили: «Я не технарь, но теперь я fullstack-разработчик». Это расширение круга задач; ИИ открывает им новые возможности. В отличие от этого, некоторые пользователи ускоряли задачи, которые уже выполняли, как бухгалтер, сказавший: «Я построил инструмент, который помогает мне завершить финансовую задачу за 15 минут вместо прежних 2 часов». Прирост качества часто шёл от более тщательной проверки кода, договоров и других документов. И небольшая доля респондентов упоминала низкую стоимость использования ИИ: «Если я найму SMM-менеджера, это превысит мой бюджет».
Мы обнаружили, что самое распространённое улучшение продуктивности — это расширение круга задач, которое назвали 48% пользователей, явно упомянувших эффекты на продуктивность. 40% пользователей, упомянувших продуктивность, делали акцент на скорости.
Опыт людей с Claude также может влиять на их опасения по поводу ИИ. Чтобы оценить это, мы измеряли ускорение, о котором сообщали респонденты, выделяя, стала ли их работа теперь намного медленнее (мы кодировали как 1), не изменилась по скорости (4) или стала намного быстрее (7).
Мы обнаружили, что связь между ускорением и воспринимаемой угрозой работе U-образная (см. Рисунок 6). Самый левый столбец показывает респондентов, сообщивших, что ИИ их замедлил. Эти респонденты чаще указывали, что ИИ представляет значительную угрозу их источнику дохода. Например, некоторые работники творческих профессий, такие как художники и писатели, считали ИИ слишком сковывающим и жёстким, чтобы помогать им в их собственной работе. В то же время они опасались, что распространение ИИ в творческих сферах усложнит им поиск работы.
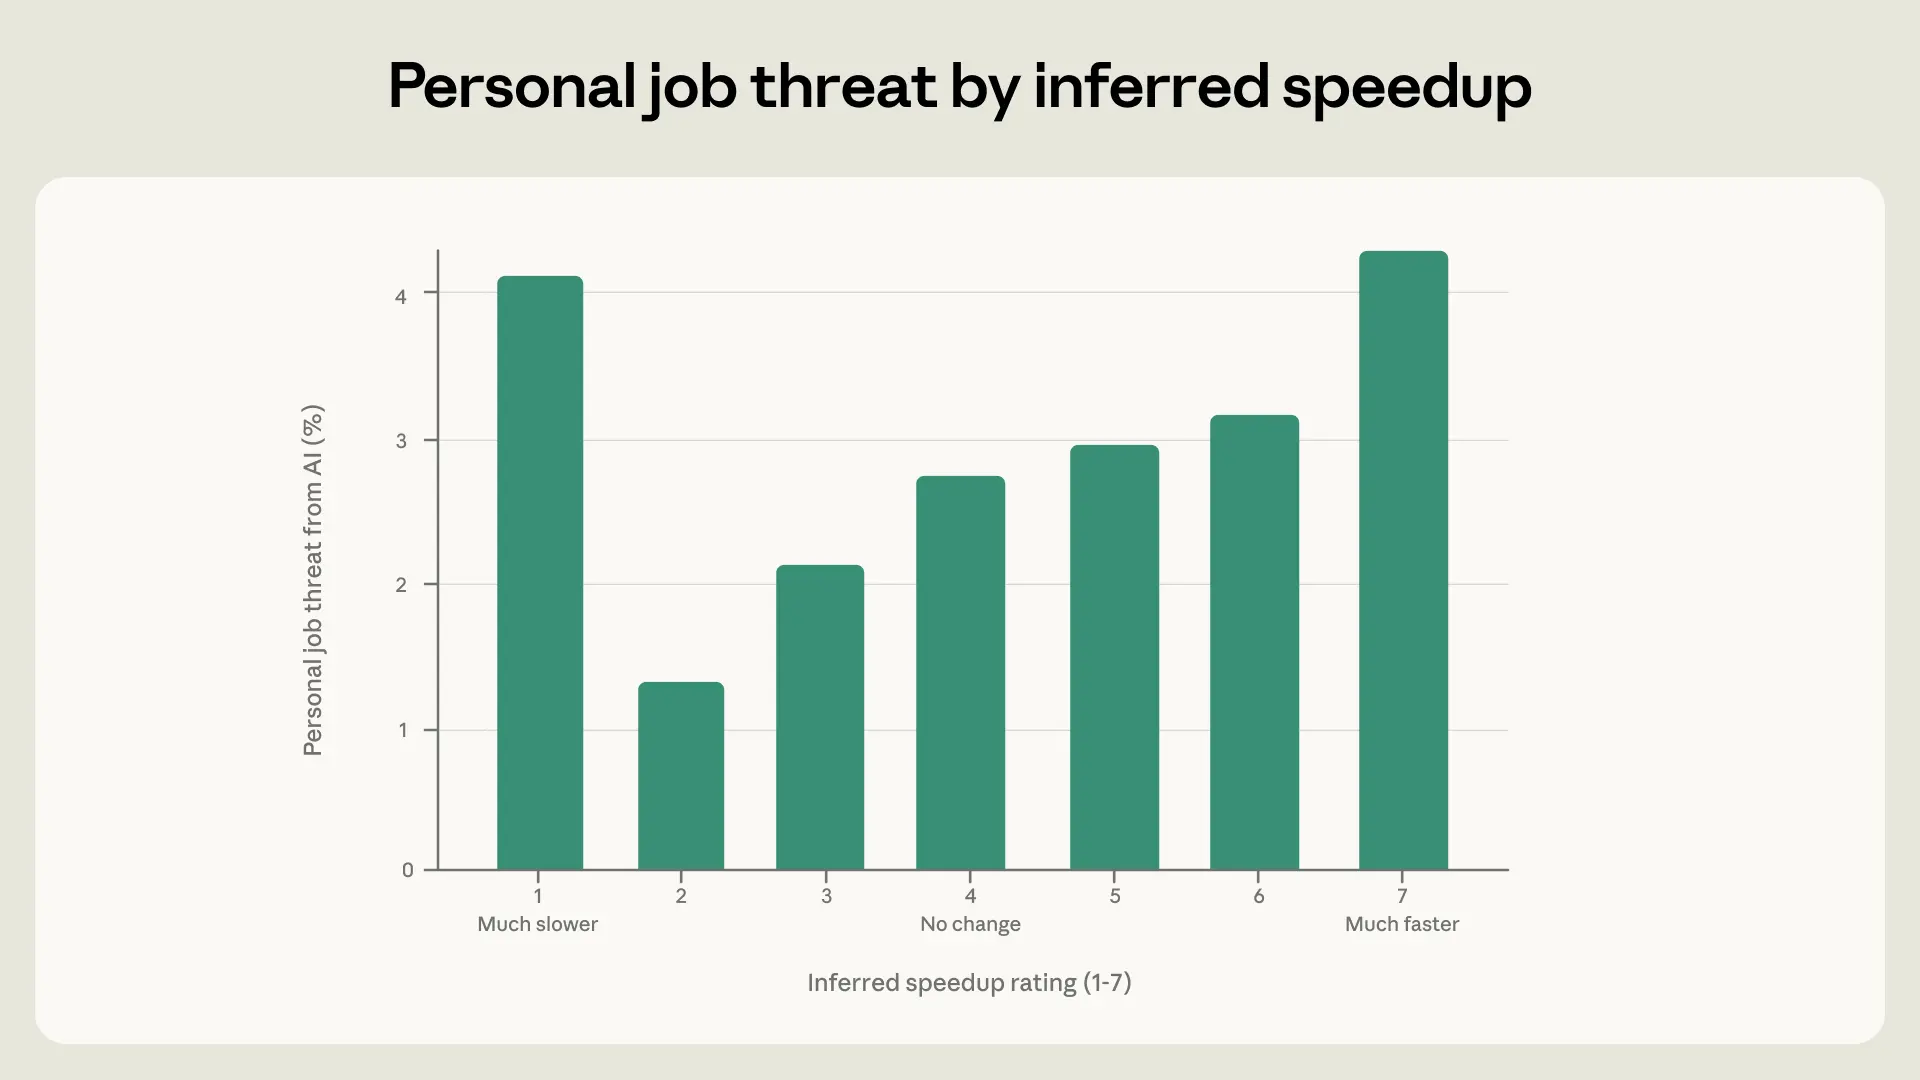
Для остальных респондентов воспринимаемая угроза работе последовательно растёт с уровнем ускорения, подразумеваемым их ответами. В этом есть определённый экономический смысл: если время, необходимое для выполнения задач, быстро сокращается, может возрасти неопределённость относительно будущей жизнеспособности роли.
Обсуждение
Economic Index показывает, что люди делают с ИИ. Но ещё один ключевой источник для понимания экономического влияния ИИ — услышать напрямую от людей об их опыте. Изученные здесь ответы показывают, что интуиции людей соответствуют данным об использовании: они больше всего беспокоятся о влиянии ИИ в тех профессиях, где мы наблюдаем, что Claude выполняет больше всего работы. Мы также выявили более высокий уровень экономической тревожности среди работников на ранних этапах карьеры, что согласуется с прошлыми исследованиями.
Есть также признаки того, что Claude расширяет возможности своих пользователей. Люди чаще всего говорят о выгодах, идущих к ним самим, а не к работодателям или ИИ-компаниям. Высокооплачиваемые работники наиболее восторженно отзывались о влиянии ИИ на продуктивность, но люди на низкооплачиваемых работах и с более низким уровнем образования также сообщали о значительном приросте продуктивности. Большинство респондентов сообщили, что Claude расширил их возможности, расширяя круг их работы или ускоряя её. Но пользователи, испытывающие наибольшее ускорение, также сильнее всех нервничали по поводу влияния ИИ на занятость.
К нашему анализу есть ключевые оговорки, обусловленные природой данных. Во-первых, наш опрос ограничен пользователями личных аккаунтов на Claude.ai, согласившимися ответить. Среди прочих возможных смещений эти пользователи могут быть более склонны воспринимать выгоды как идущие к ним самим. Во-вторых, пользователей напрямую не спрашивали о многих из выведенных здесь переменных, поэтому наши выводы о профессии, этапе карьеры и других переменных по контекстным подсказкам могут быть ошибочными. С этим связано и то, что, поскольку опрос открытого формата, наши измерения основаны на том, что респонденты случайно упомянули; эти результаты должны быть подтверждены структурированными опросами, прямо задающими вопросы по этим темам.
Тем не менее интервью выявляют реальные инсайты о чувствах людей вокруг экономики ИИ, показывая, как качественные данные могут порождать количественные гипотезы. И сама по себе большая доля опасений, связанных с экономикой, — это сильный сигнал.
Приложение
См. финальный раздел приложенного PDF.
Благодарности
Мы благодарим 80 508 пользователей Claude, которые поделились своими историями.
Maxim Massenkoff руководил анализом и написал пост в блоге. Saffron Huang руководила проектом интервью и оказывала наставническую поддержку на протяжении всей работы.
Zoe Hitzig и Eva Lyubich предоставили критически важную обратную связь и методологическое руководство. Keir Bradwell и Rebecca Hiscott оказали редакторскую поддержку. Hanah Ho и Kim Withee внесли вклад в дизайн. Grace Yun, AJ Alt и Thomas Millar реализовали Anthropic Interviewer внутри Claude.ai. Chelsea Larsson, Jane Leibrock и Matt Gallivan внесли вклад в дизайн опроса и пользовательский опыт. Theodore Sumers внёс вклад в инфраструктуру обработки и кластеризации данных. Peter McCrory, Deep Ganguli и Jack Clark предоставили критически важную обратную связь, направление и организационную поддержку.
Кроме того, мы благодарим Miriam Chaum, Ankur Rathi, Santi Ruiz и David Saunders за их обсуждение, обратную связь и поддержку.
Сноски
Мы выводили профессии людей по первому вопросу опроса («Для чего вы в последний раз использовали ИИ-чатбота?») или по указаниям в других ответах.Это исходило из различных указаний в письменных ответах. Например, несколько пользователей упоминали использование Claude для домашних заданий, что относило их к группе ранней карьеры. А многие говорили о том, что управляют собственным бизнесом и участвуют в решениях по найму, что относило их к группе старших специалистов.Шкала не отцентрована, потому что большинство людей говорят положительные вещи о продуктивности, давая почти исключительно 6 и 7 по исходной шкале Лайкерта. Использованная нами здесь шкала шла от 1 = менее продуктивен, 2 = без изменений, 3 = немного более продуктивен, 4 = умеренно более продуктивен, 5 = существенно более продуктивен, 6 = намного более продуктивен, до 7 = трансформативно более продуктивен — ИИ фундаментально изменил то, что или сколько они могут производить.Удаление этих «соло-предпринимателей» по-прежнему оставляет управленческие профессии наравне с профессиями из сферы вычислений и математики по самой высокой выгоде в продуктивности.Главная оговорка, однако, в том, что этот опрос был разослан людям с личными аккаунтами Claude. Более репрезентативная картина включала бы и корпоративных пользователей, которые могут быть склонны чаще говорить, что ценность достаётся их работодателям.
Связанные материалы
2028: два сценария глобального лидерства в ИИ
Наши взгляды на конкуренцию в области ИИ между США и Китаем.
Учим Claude «почему»
Новое исследование о том, как мы снизили агентскую рассогласованность.
Natural Language Autoencoders: превращение мыслей Claude в текст
ИИ-модели вроде Claude говорят словами, но думают числами. В этом исследовании мы обучаем Claude переводить свои мысли в читаемый человеком текст.