
How Australia Uses Claude: Findings from the Anthropic Economic Index
Anthropic выходит на рынок Австралии: в ближайшие недели откроется новый офис в Сиднее, а с австралийским правительством подписан Меморандум о взаимопонимании по сотрудничеству в исследованиях безопасности ИИ. По данным Anthropic Economic Index, Австралия — один из лидеров по использованию Claude: на неё приходится 1,6% мирового трафика Claude.ai (11-е место), а подушевое использование более чем вчетверо превышает ожидаемое (индекс AUI 4,1, 7-е место в мире). Внутри страны использование сосредоточено в Новом Южном Уэльсе (37% разговоров) и Виктории (31%), и распределение по штатам объясняется составом рабочей силы, а не уровнем дохода. Структура задач близка к другим англоязычным странам (46% — работа, 7% — учёба, 47% — личное использование), но более разнообразна за счёт меньшей доли задач по программированию (категория Computer & Mathematical на 8 п.п. ниже мировой нормы). Австралийцы задают Claude более сложные по уровню образования запросы (≈11,9 лет обучения), но сами задачи короче (≈2,7 часа против 3,3 в среднем), а низкий показатель «автономии ИИ» (3,38 из 5) указывает на более совместный, менее делегирующий стиль работы.
Как Австралия использует Claude: выводы из Anthropic Economic Index

Anthropic выходит на рынок Австралии. В ближайшие недели мы открываем новый офис в Сиднее, а также подписали Меморандум о взаимопонимании с правительством Австралии о сотрудничестве в исследованиях безопасности ИИ и поддержке целей Национального плана Австралии в области ИИ. Чтобы отметить это событие, мы решили подробнее рассмотреть, как австралийцы используют Claude.
Ключевые выводы
Австралия входит в число ведущих пользователей Claude, обеспечивая 1,6% мирового трафика Claude.ai. В пересчёте на душу населения австралийцы используют Claude более чем вчетверо активнее, чем можно было бы ожидать исходя из численности населения. Использование внутри Австралии сосредоточено в двух штатах: Новый Южный Уэльс (37% разговоров) и Виктория (31%). В каждом другом штате и территории подушевое использование Claude ниже. Структура сценариев использования в Австралии в целом соответствует англоязычным странам-аналогам: 46% разговоров с Claude связаны с работой, 7% — с учёбой, 47% — с личным использованием. Это профиль, типичный для стран с высоким доходом и высоким уровнем внедрения. Но набор задач в Австралии более разнообразен. Как и в других странах, задачи категории Computer & Mathematical остаются крупнейшей отдельной категорией в нашем наборе данных, однако эта категория примерно на 8 процентных пунктов ниже мирового базового уровня. Это компенсируется более высокими, чем в среднем, объёмами офисных, торговых, управленческих и личных задач. Пользователи в Австралии склонны давать Claude более сложные задачи, если измерять сложность предполагаемым количеством лет обучения, необходимым для понимания запроса. При этом, по нашим оценкам, без ИИ эти задачи заняли бы примерно на 20% меньше времени, чем в среднем. Иными словами, по сравнению с тем, как Claude используют в остальном мире, задачи австралийцев связаны с более высоким уровнем образования, но меньшей продолжительностью. Как и многие другие страны с высоким уровнем внедрения, Австралия имеет относительно низкий показатель «автономии ИИ» (3,38 по шкале от 1 до 5), что говорит о том, что австралийцы используют Claude более совместно и менее делегируют ему задачи.
Высокое внедрение в целом, но неравномерно распределённое по штатам и территориям
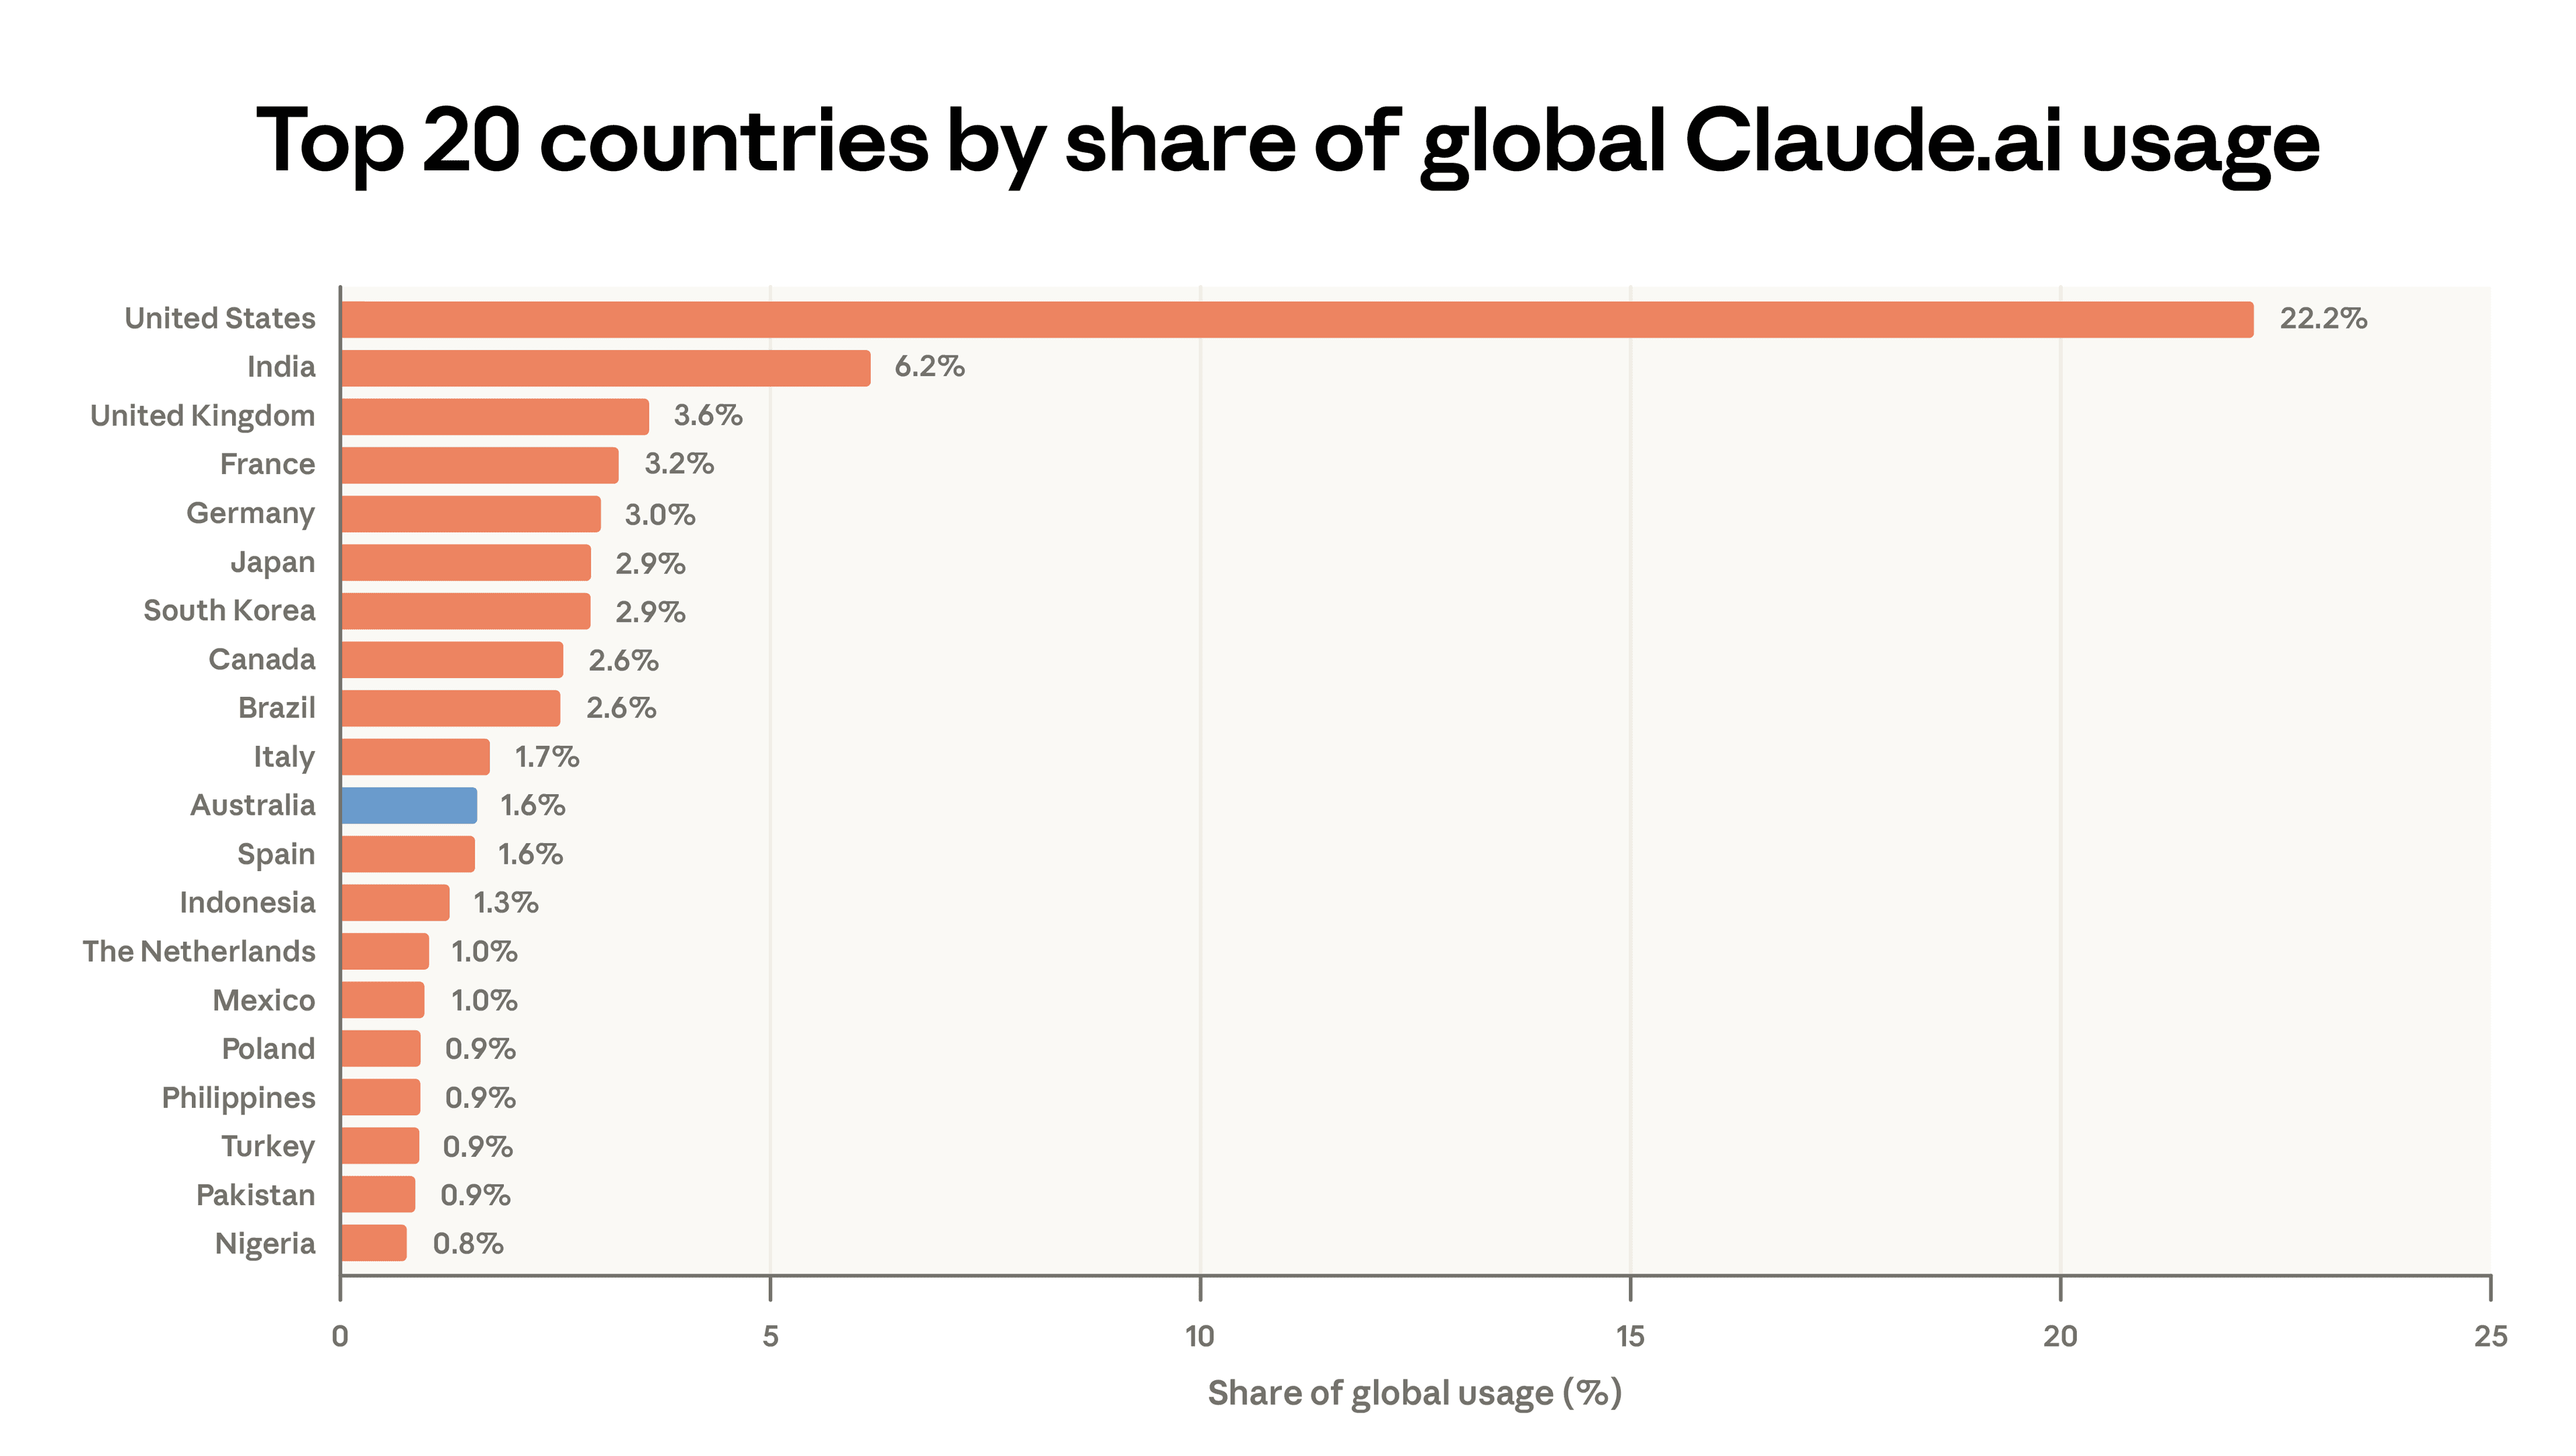
На Австралию приходится 1,6% мирового трафика Claude.ai — одиннадцатое место среди всех стран в нашей выборке за февраль 2026 года (Рисунок 1). Её индекс использования ИИ Anthropic (AUI) равен 4,1, что означает, что австралийцы используют Claude более чем в четыре раза активнее, чем можно было бы предсказать исходя из численности населения трудоспособного возраста. Это ставит Австралию в число лидеров по подушевому внедрению Claude — седьмое место после Сингапура, Израиля, Люксембурга, Швейцарии, США и Канады.
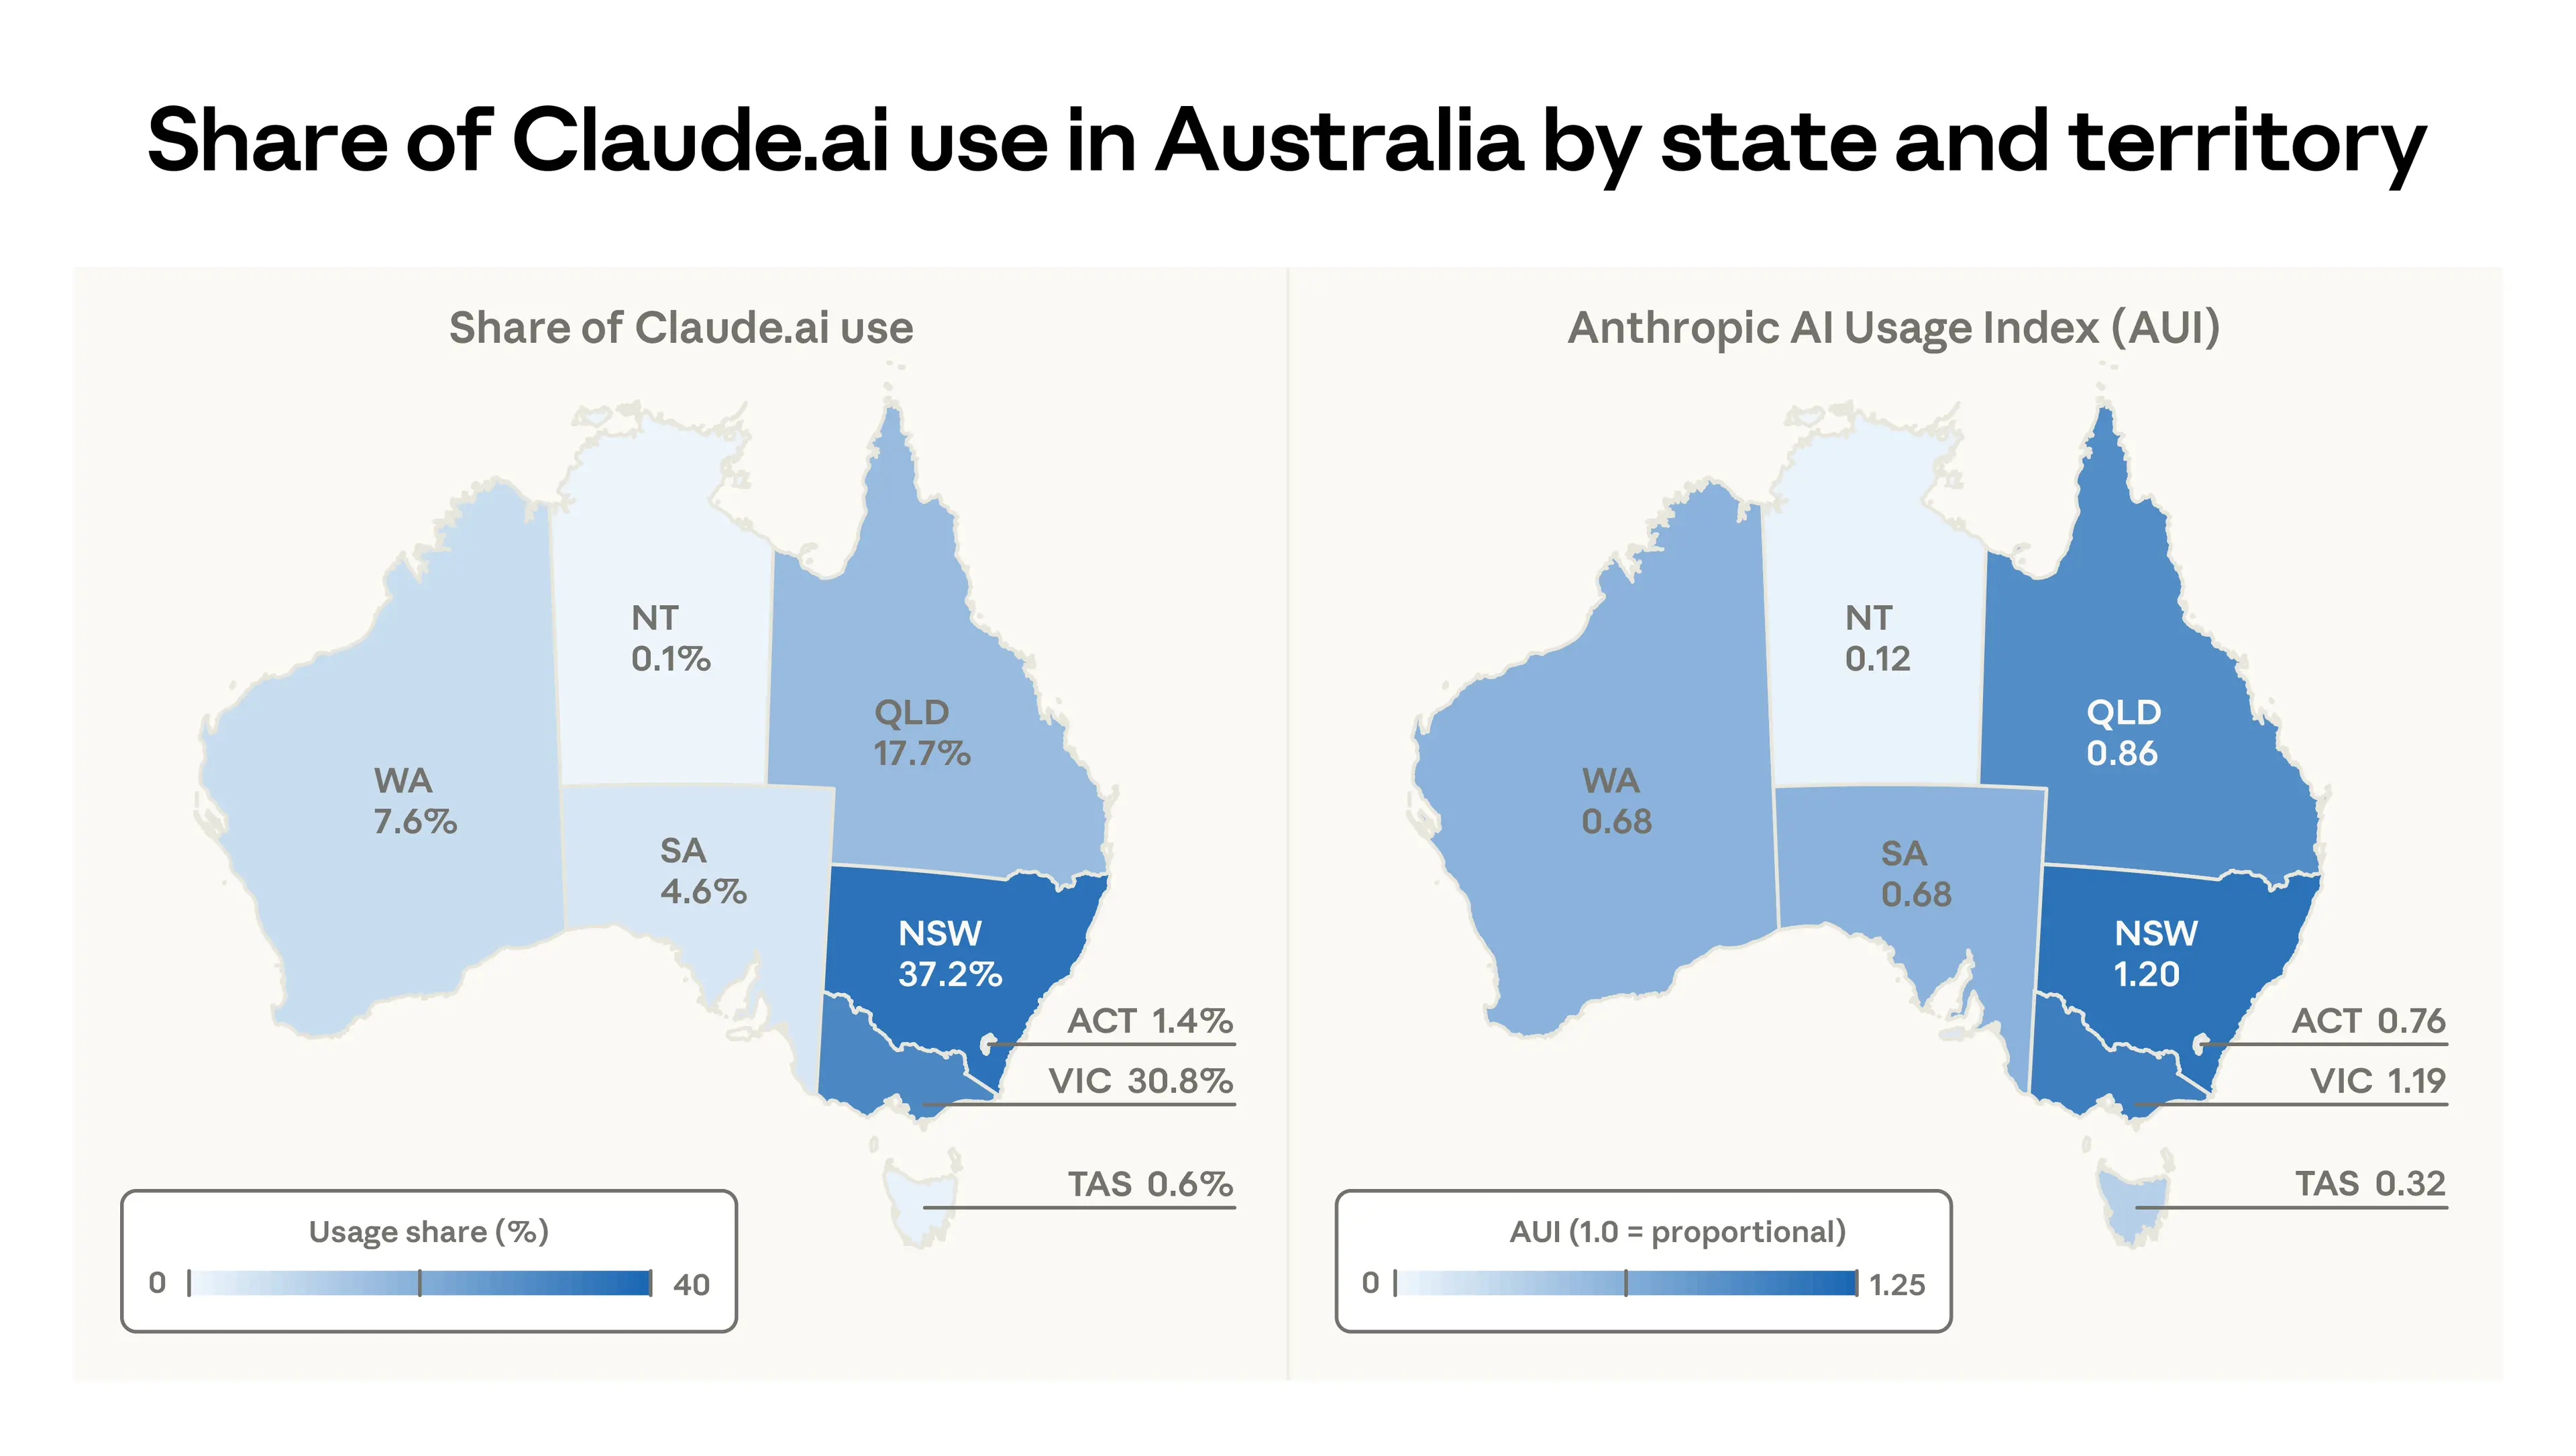
Внутри Австралии использование сосредоточено в самых населённых штатах. На Новый Южный Уэльс приходится 37,2% разговоров, за ним следуют Виктория с 30,8%, Квинсленд с 17,7%, а остальные штаты и территории в совокупности дают 14% (Рисунок 2). Численность населения трудоспособного возраста штатов и территорий во многом объясняет такой порядок. Однако с поправкой на это у Нового Южного Уэльса показатель AUI равен 1,20, а у Виктории — 1,19. Это единственные два штата с более высоким, чем ожидалось, подушевым внедрением; у каждого другого штата или территории AUI ниже 1, причём наименьшее внедрение в Западной Австралии (0,68), Тасмании (0,32) и Северной территории (0,12).
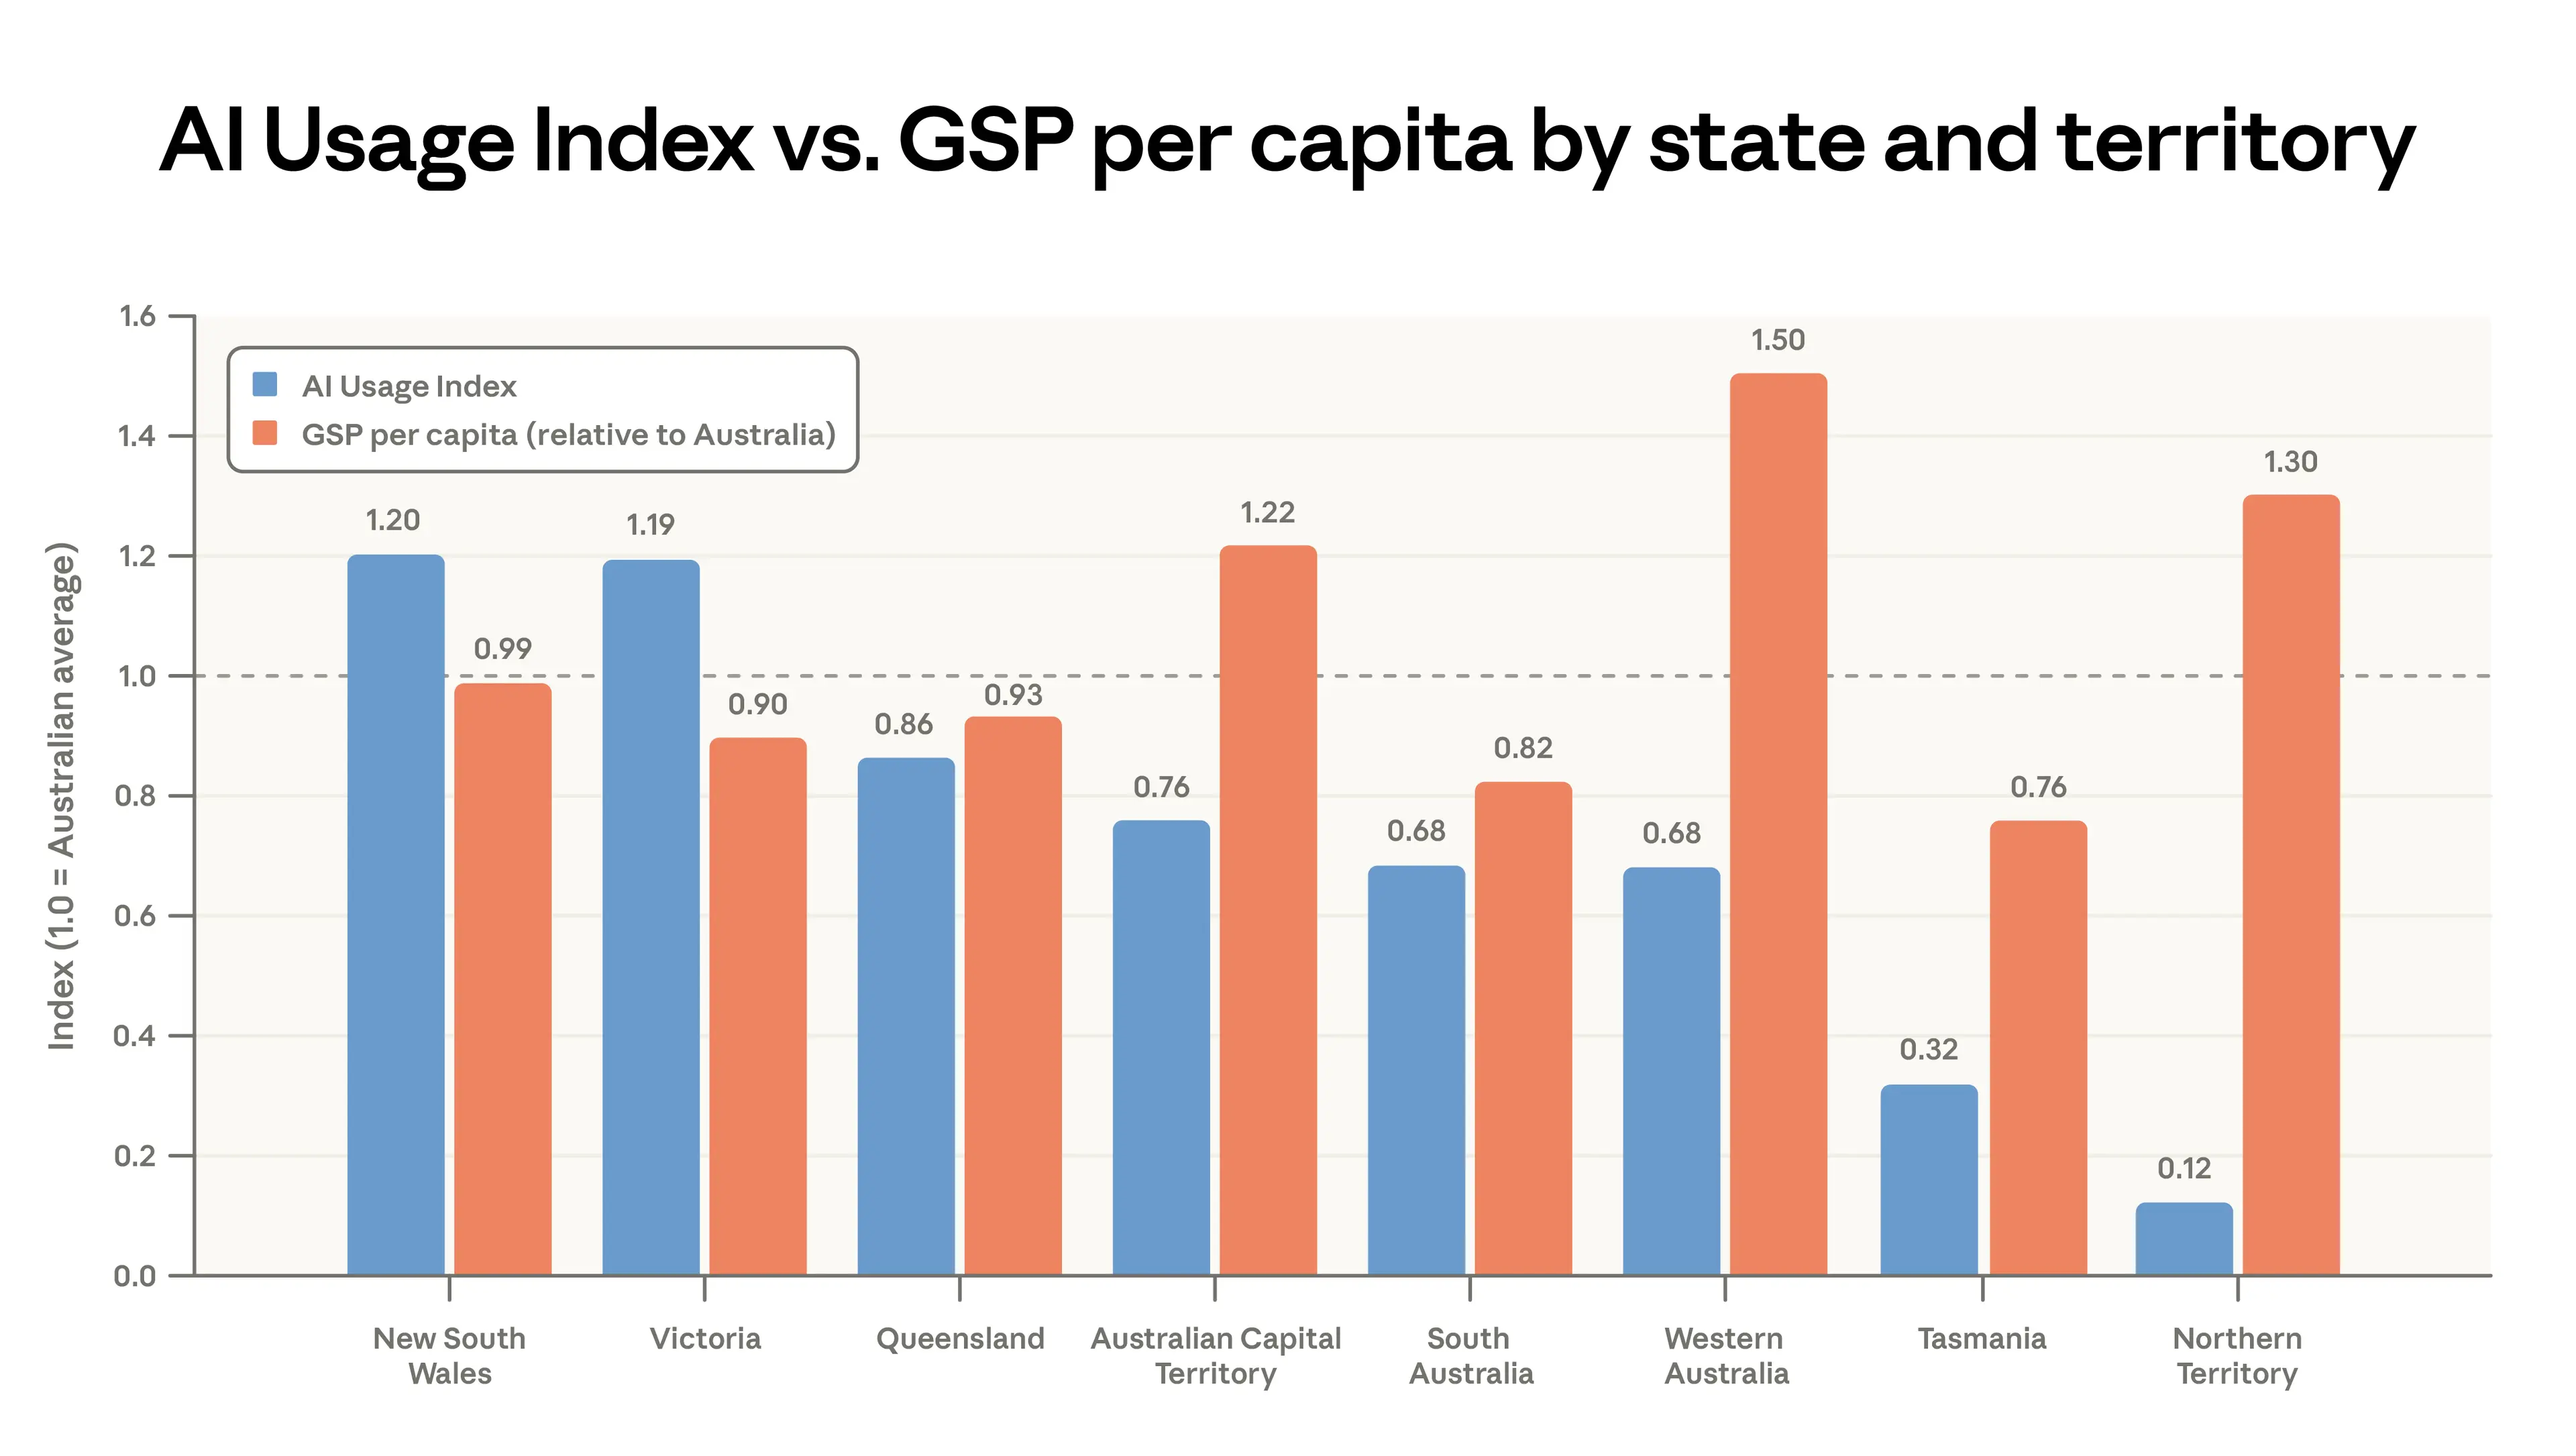
В отличие от устойчивой связи между доходом и подушевым использованием Claude, которую мы наблюдаем между странами, доход, по-видимому, не предсказывает уровень внедрения по штатам и территориям Австралии (Рисунок 3). При этом, поскольку мы можем сравнивать только восемь регионов, отсутствие корреляции между доходом и использованием носит скорее предположительный, нежели окончательный характер.
Состав местной рабочей силы — вероятный фактор того, почему внедрение, по-видимому, не связано с доходом по штатам и территориям Австралии: в богатой добывающей промышленностью Западной Австралии, штате с наивысшим GSP на душу населения, подушевое использование низкое. Северная территория также имеет высокий GSP на душу населения и низкий AUI. Вероятно, это отражает то, что в этих малонаселённых штатах и территориях относительно меньшая доля работников занята в профессиях, где Claude обычно внедряется. У Австралийской столичной территории доход выше среднего, но подушевое использование Claude ниже ожидаемого, что может отражать барьеры внедрения среди её большой доли работников государственного сектора. У двух штатов с наибольшим внедрением, Нового Южного Уэльса и Виктории, доход немного ниже среднего; высокое внедрение в этих штатах, вероятно, отражает более высокую долю работников в секторах финансов, профессиональных услуг и технологий, где использование Claude обычно выше.
Использование Claude в Австралии напоминает англоязычные страны-аналоги
В нашем четвёртом отчёте Economic Index были введены четыре экономических примитива: набор сценариев использования, степень автономии, предоставляемой Claude, успешность выполнения задач и сложность задач. На Рисунке 4 показано, где находится Австралия по каждому из них относительно других англоязычных стран (оранжевым), других стран с высоким уровнем внедрения (серым) и всех стран в нашей выборке (фиолетовым).
С точки зрения того, как используется Claude, Австралия похожа на свои англоязычные страны-аналоги. 46% австралийских разговоров классифицируются как связанные с работой, что близко к медиане и находится в середине диапазона англоязычных стран. На учёбу приходится 7% австралийского использования, что ближе к нижней части распределения (и ниже США, Великобритании и Канады); в странах с более низким подушевым внедрением доля учёбы в два-три раза выше. Доля разговоров для личного использования, составляющая 47%, близка к верхней границе распределения.
Эта картина для Австралии согласуется со связью, которую мы зафиксировали в нашем отчёте об экономических примитивах между подушевым доходом и сценариями использования: в более богатых странах обычно ниже доля учёбы и выше доля личного использования.
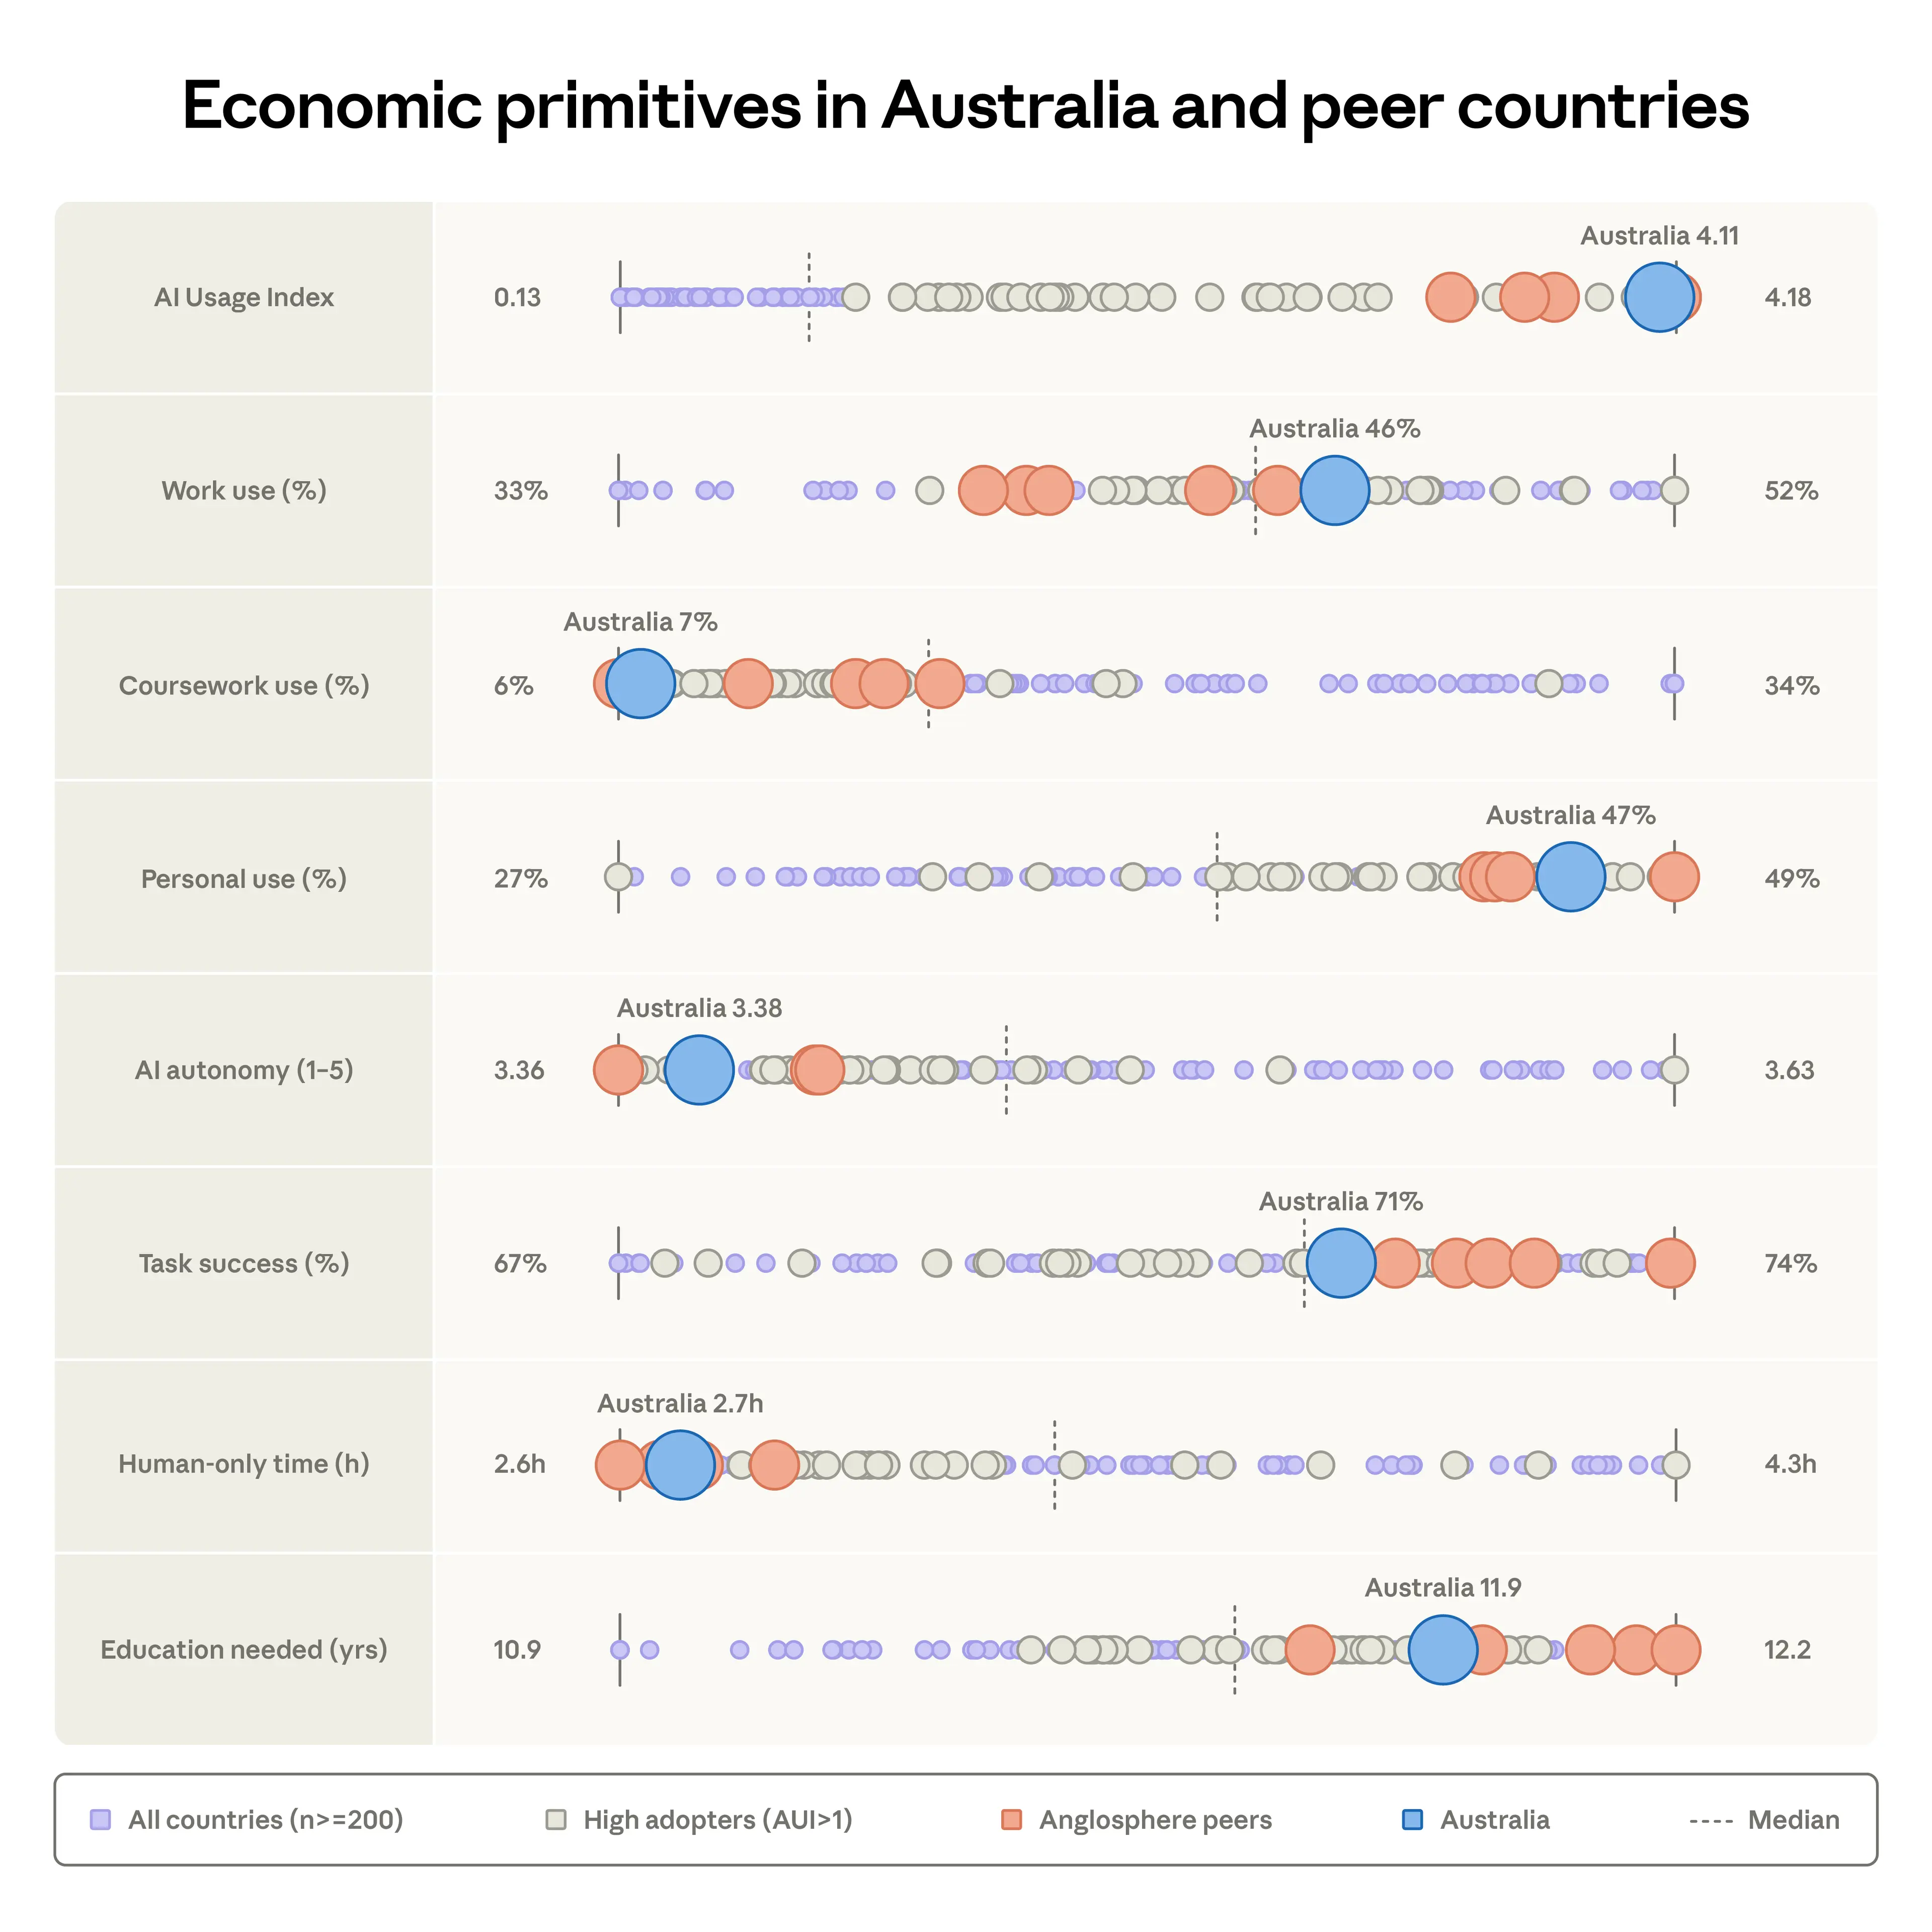
Австралия находится ближе к нижней границе по автономии ИИ — 3,38 по шкале от 1 до 5, причём другие англоязычные страны располагаются рядом. Более низкая автономия указывает на то, что пользователи сохраняют больше контроля над принятием решений в своих разговорах, а не полностью делегируют их модели. Это согласуется с тем, что страны с высоким уровнем внедрения склонны использовать Claude более совместно и менее директивно.
Австралия находится ниже медианы по одному показателю сложности задач, но ближе к верхней границе по другому. Сама средняя задача в Австралии относительно менее трудоёмка по времени: квалифицированному специалисту потребовалось бы около 2,7 часа на её выполнение без ИИ против межстранового среднего в 3,3 часа. Но для понимания запросов австралийских пользователей, по оценкам, требуется 11,9 лет обучения, что сопоставимо с другими англоязычными странами и выше мировой медианы. Обе закономерности согласуются с межстрановыми связями, которые мы зафиксировали в нашем январском отчёте Economic Index, где интенсивность внедрения Claude положительно коррелирует со сложностью запросов человека и отрицательно — с оценками продолжительности задачи «без ИИ».
В Австралии — более широкий набор задач при меньшей доле программирования
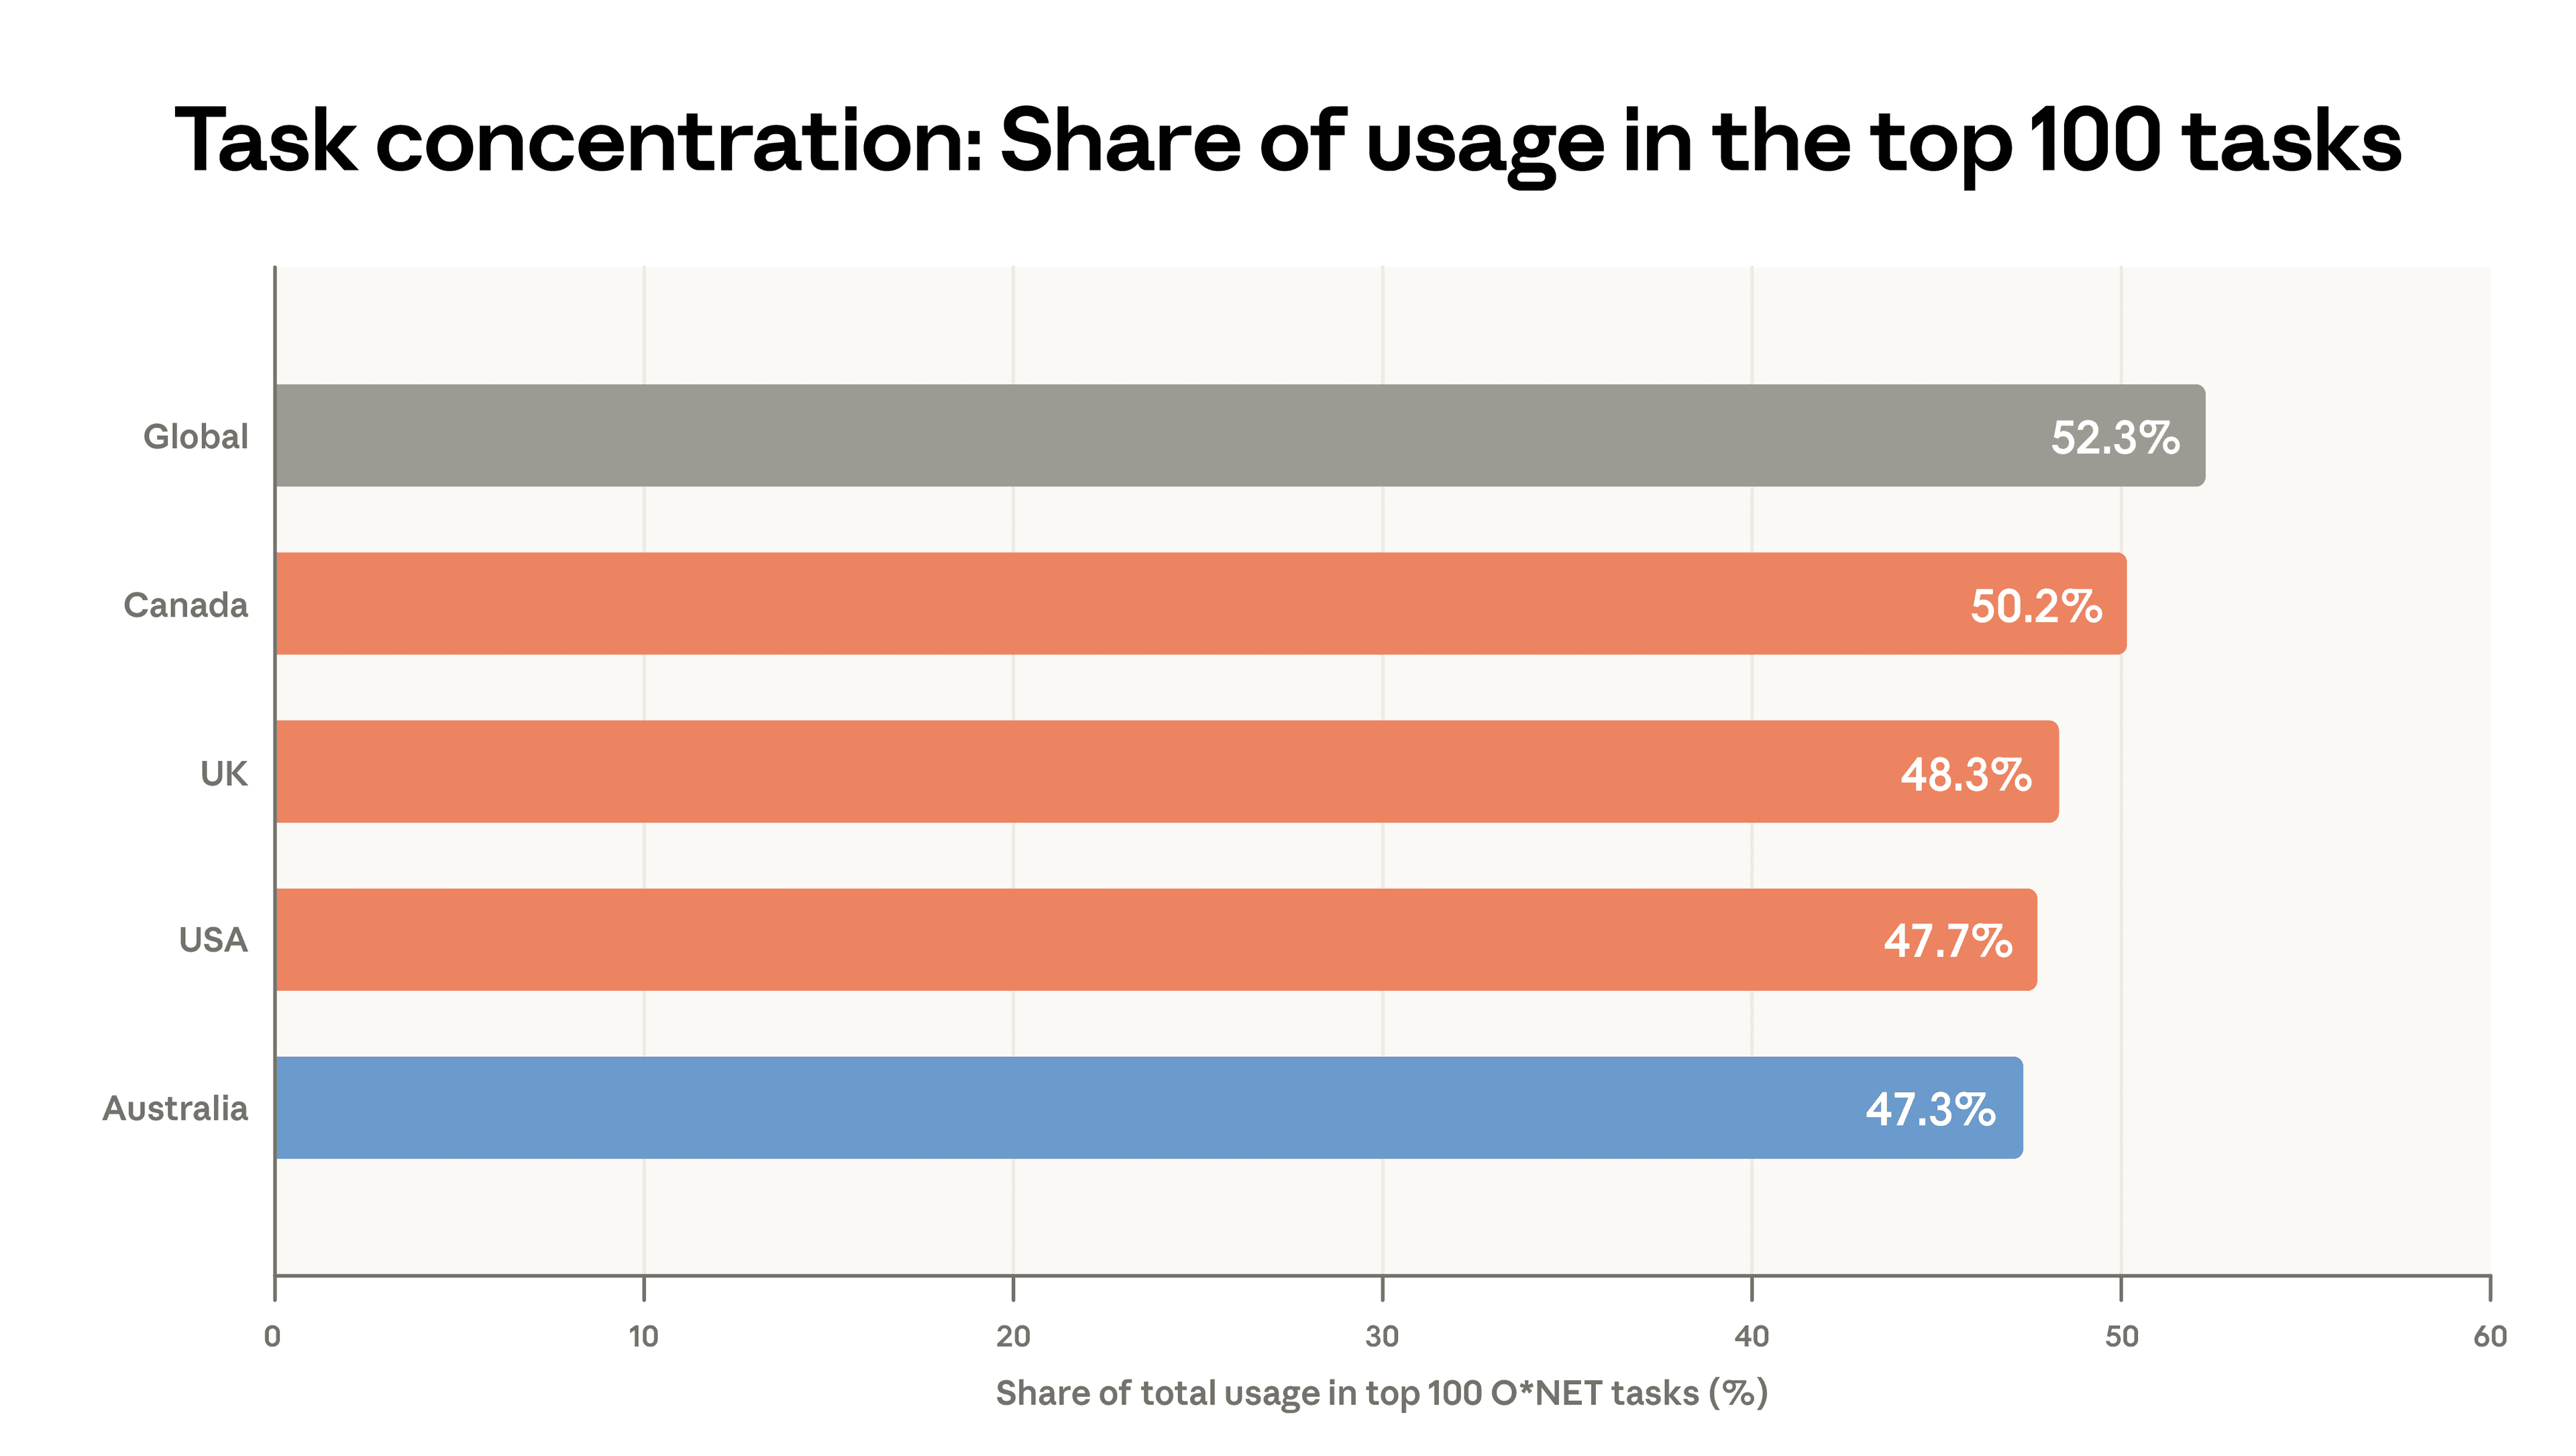
Использование Claude в Австралии более разнообразно, чем в англоязычных странах-аналогах и относительно более широкого мирового среднего. На Рисунке 5 показана доля использования каждого региона, которую покрывают его 100 самых распространённых задач (где задачи классифицируются по O*NET — таксономии задач, характеризующих профессии во всей экономике). Более низкие значения на этом рисунке указывают на то, что Claude используется для более широкого круга задач, поскольку топ-100 занимают меньшую долю. На топ-100 задач Австралии приходится 47,3% её использования, что ниже США (47,7%), Великобритании (48,3%) и Канады (50,2%) и на пять процентных пунктов ниже мирового показателя в 52,3%.
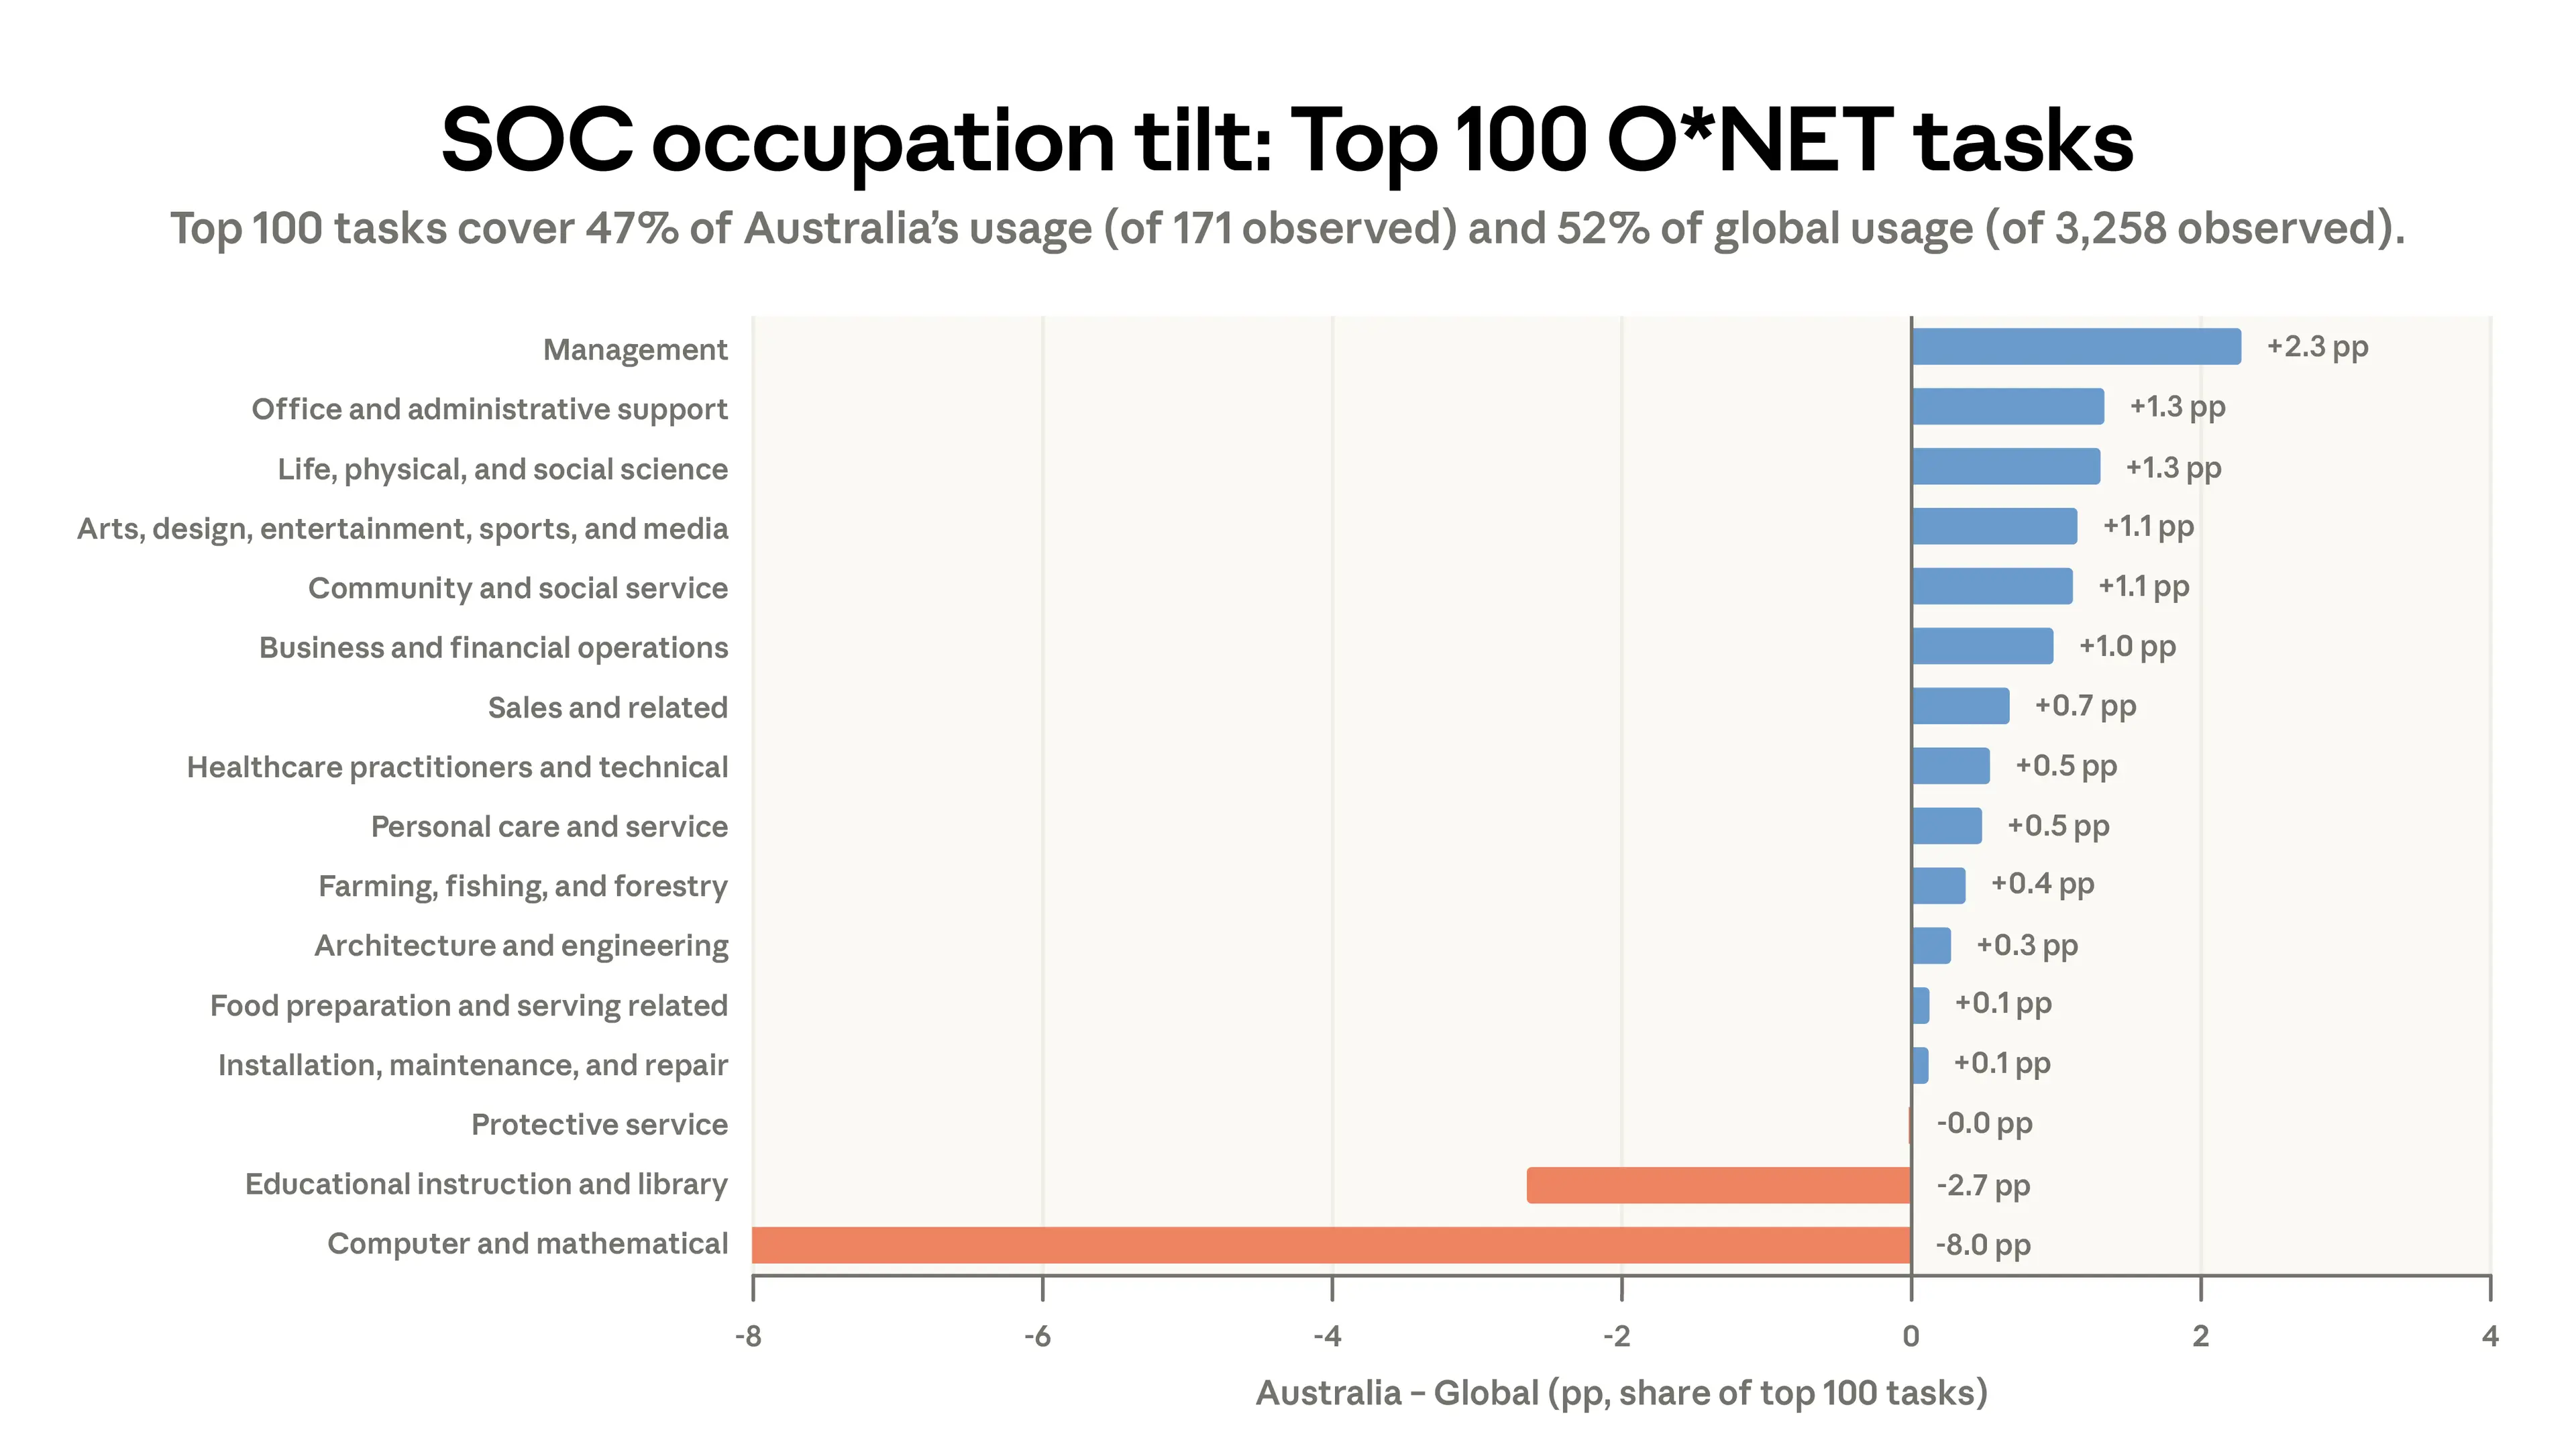
Более широкое разнообразие использования в Австралии связано в основном с меньшей долей задач, связанных с программированием. На Рисунке 6 показано, как состав топ-100 задач Австралии отличается от мирового топ-100 по основным группам SOC (широкие категории профессий, определённые Бюро статистики труда США). Задачи категории Computer and Mathematical в Австралии на 8,0 процентных пункта ниже. Ни одна другая категория использования не приближается к такой величине отличия от мирового среднего, хотя задачи, связанные с образованием, почти на три процентных пункта ниже мирового паритета. Компенсирующие положительные значения распределены по многим группам, во главе с Management (+2,3 п.п.), Office and Administrative Support (+1,3 п.п.) и профессиями Life, Physical, and Social Science (+1,3 п.п.).
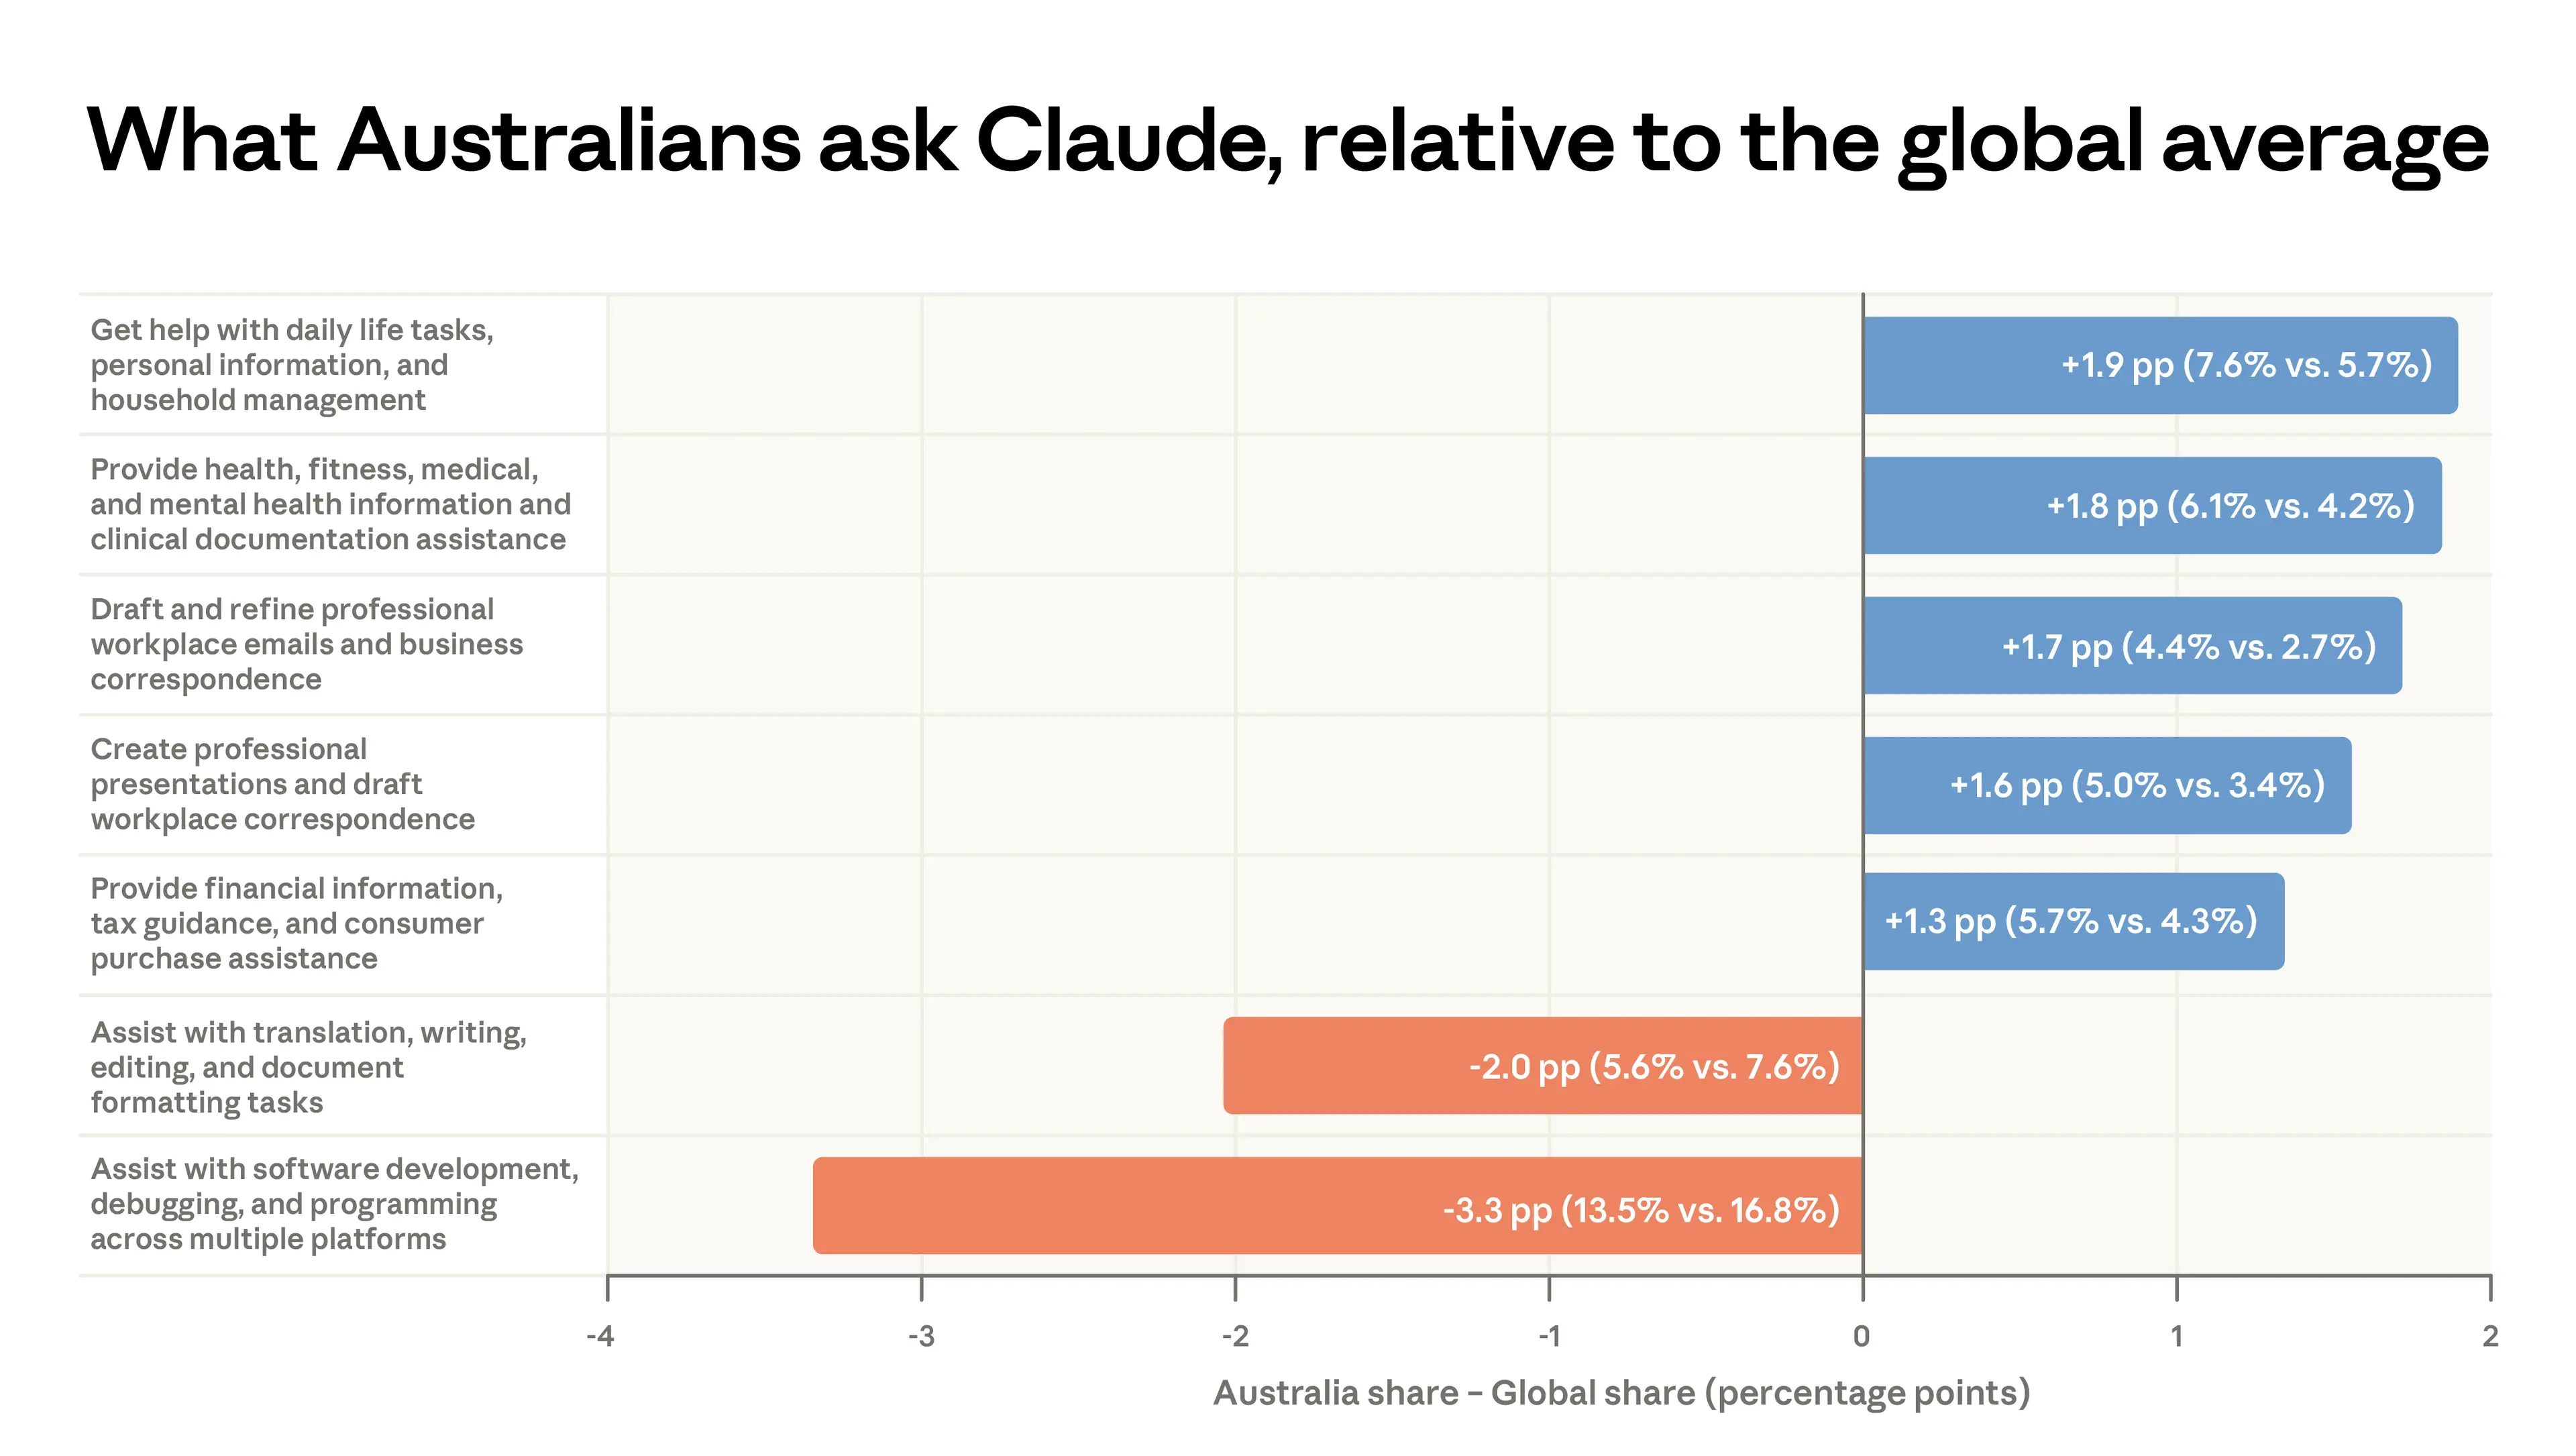
На уровне отдельных кластеров запросов — категорий того, о чём пользователи просят Claude, — картина схожа (Рисунок 7). Кластер, наиболее недопредставленный в Австралии относительно мирового распределения, — это общая помощь в программировании: 13,5% австралийского использования против 16,8% в мире. Перевод документов также недопредставлен, что согласуется с тем, что Австралия является преимущественно англоязычным рынком. Наиболее перепредставленные кластеры — это сочетание личного использования (например, управление личной жизнью (+1,9 п.п.) и поддержка здоровья и благополучия (+1,8 п.п.)) и нетехнической профессиональной работы, включая рабочую переписку (+1,7 п.п.), деловые документы (+1,6 п.п.) и финансовые консультации (+1,3 п.п.).
Страны с более высоким уровнем внедрения, как правило, используют Claude более широко, поэтому часть более низкой доли программирования в Австралии ожидаема. Отставание Австралии по категории Computer and Mathematical в 8,0 п.п. полностью соответствует среднему по англоязычным странам в 8,9 п.п. Где Австралия отличается от своих аналогов — так это в том, что заполняет этот пробел: она больше склоняется к Management (+2,3 п.п. против +1,2 п.п. у англоязычных стран) и Office and Administrative Support (+1,3 п.п. против +0,1 п.п.), а не к Educational Instruction (−2,7 п.п. против +1,6 п.п. у аналогов).
Заключение
Австралия входит в число лидеров по подушевому внедрению Claude, причём использование более чем вчетверо превышает то, что можно было бы предсказать исходя из численности её населения трудоспособного возраста. Характер этого использования — преимущественно работа и личные задачи, а не учёба, сложные запросы при относительно коротких задачах и при меньшем делегировании Claude — близко соответствует другим англоязычным экономикам и межстрановым связям, проявляющимся в Anthropic Economic Index.
Где Австралия более своеобразна — так это в широте того, для чего используется Claude. Австралийское использование более разнообразно, чем мировой агрегат, почти полностью за счёт меньшей доли работы, связанной с программированием; компенсирующий рост распределён по категориям офисных, торговых, управленческих и личных задач, а не сосредоточен в какой-то одной категории. Как и в других странах с высоким уровнем внедрения, пользователи в Австралии склонны больше сотрудничать с Claude и реже делегировать ему принятие решений.
Внутри Австралии внедрение сосредоточено в Новом Южном Уэльсе и Виктории, а различия на уровне штатов отслеживают состав рабочей силы, а не подушевой доход — что согласуется с закономерностью по штатам США, но контрастирует с градиентом дохода между странами.
Цитирование
@online{mccrory2026australiacountrybrief, author = {Peter McCrory}, title = {How Australia Uses Claude: Findings from the Anthropic Economic Index}, date = {2026-03-31}, year = {2026}, url = {https://www.anthropic.com/research/australia-brief-economic-index-march-2026}, }
Благодарности
Keir Bradwell, Ria Strasser Galvis, Ryan Heller, Eva Lyubich, Jennifer Marintez, Maxim Massenkoff, Jared Mueller, Sarah Pollack
Связанные материалы
2028: Два сценария мирового лидерства в области ИИ
Наши взгляды на конкуренцию в области ИИ между США и Китаем.
Обучаем Claude понимать «почему»
Новое исследование о том, как мы снизили агентную рассогласованность.
Natural Language Autoencoders: превращаем мысли Claude в текст
Модели ИИ вроде Claude говорят словами, но думают числами. В этом исследовании мы обучаем Claude переводить свои мысли в понятный человеку текст.