
Anthropic Economic Index report: Economic primitives
Четвёртый отчёт Anthropic Economic Index вводит «экономические примитивы» — базовые метрики использования Claude, охватывающие сложность задач, навыки пользователя и ИИ, степень автономии, успешность и тип использования (работа, учёба, личное). Анализ 1 млн диалогов Claude.ai и 1 млн записей API за ноябрь 2025 года показывает, что использование по-прежнему сконцентрировано на задачах, связанных с кодингом (34% на Claude.ai), а аугментация вновь преобладает над автоматизацией (52% против 45%). Внутри США наблюдается быстрая конвергенция использования между штатами — при сохранении темпов выравнивание произойдёт за 2–5 лет, что в 10 раз быстрее распространения технологий XX века. Claude лучше справляется с простыми задачами: при увеличении сложности процент успешного выполнения падает, а учёт надёжности снижает оценку прироста производительности труда с 1,8 до примерно 1,0 процентного пункта в год. Удаление задач, которые Claude уже выполняет, в целом приводит к «деквалификации» рабочих мест, поскольку ИИ берёт на себя более квалифицированные компоненты профессий.
Отчёт Anthropic Economic Index: экономические примитивы

Введение
Как ИИ перестраивает экономику?
В этом отчёте представлены новые метрики использования ИИ, дающие развёрнутую картину взаимодействий с Claude в ноябре 2025 года, непосредственно перед выпуском Opus 4.5. Эти «примитивы» — простые, базовые показатели того, как используется Claude, которые мы генерируем, задавая Claude конкретные вопросы об анонимизированных диалогах Claude.ai и собственного (1P) API — охватывают пять измерений, значимых для экономического воздействия ИИ: навыки пользователя и ИИ, сложность задач, степень автономии, предоставляемой Claude, успешность Claude, а также то, используется ли Claude в личных, образовательных или рабочих целях.
Результаты выявляют поразительные географические различия, реальные оценки горизонтов задач ИИ и основу для пересмотренных оценок макроэкономического влияния Claude.
Данные, публикуемые вместе с этим отчётом, являются наиболее исчерпывающими на сегодняшний день: они охватывают пять новых измерений использования ИИ, потребительское и корпоративное использование, а также разбивку по странам и регионам для Claude.ai.
Что изменилось с момента нашего прошлого отчёта
В первой главе мы возвращаемся к выводам нашего предыдущего отчёта Economic Index, опубликованного в сентябре 2025 года. Мы обнаружили следующее:
Использование Claude по-прежнему сконцентрировано на определённых задачах, большинство из которых связано с программированием Хотя мы наблюдаем более 3 000 уникальных рабочих задач на Claude.ai, 10 самых распространённых задач составляют 24% выборки диалогов — незначительный рост по сравнению с прошлым отчётом. Паттерны аугментации (диалоги, в которых пользователь учится, итеративно работает над задачей или получает обратную связь от Claude) немного превысили половину диалогов на Claude.ai. Напротив, автоматизированное использование по-прежнему доминирует в трафике 1P API, что отражает его программный характер.Глобальное использование остаётся устойчиво неравномерным, тогда как штаты США сближаютсяСША, Индия, Япония, Великобритания и Южная Корея лидируют по общему объёму использования Claude.ai. В мировом масштабе неравномерность внедрения по-прежнему хорошо объясняется ВВП на душу населения. Внутри США ключевую роль в формировании неравномерного внедрения играет состав рабочей силы: штаты с большей долей специалистов в области компьютерных и математических наук демонстрируют систематически более высокое использование Claude.
Несмотря на сохраняющуюся значительную концентрацию, с момента нашего прошлого отчёта использование Claude стало заметно более равномерно распределённым между штатами США. Если эта тенденция сохранится, использование на душу населения выровняется по стране за 2–5 лет.
Представление и анализ наших новых экономических примитивов
Во второй главе мы обсуждаем мотивацию и представляем наши новые экономические примитивы, включая то, как они были отобраны и операционализированы, а также их ограничения. Мы также приводим данные о том, что наши примитивы направленно точно отражают аспекты реальных паттернов использования по сравнению с внешними бенчмарками. В третьей и четвёртой главах мы используем эти примитивы для дальнейшего исследования последствий для внедрения и производительности. Мы обнаружили следующее:
Использование Claude диверсифицируется с ростом внедрения и доходов Хотя наиболее распространённое использование Claude — для работы, использование для учебных заданий наиболее высоко в странах с самым низким ВВП на душу населения, тогда как богатые страны демонстрируют самые высокие показатели личного использования. Это согласуется с простой историей кривой внедрения: ранние пользователи в менее развитых странах, как правило, являются техническими специалистами с конкретными высокоценными приложениями или используют Claude для обучения, тогда как зрелые рынки демонстрируют диверсификацию использования в сторону повседневных и личных целей.Claude успешно справляется с большинством задач, но хуже — с наиболее сложными Мы обнаружили, что Claude в целом успешно выполняет поставленные задачи, и что образовательный уровень его ответов, как правило, соответствует уровню ввода пользователя. Claude испытывает трудности с более сложными задачами: по мере увеличения времени, которое потребовалось бы человеку для выполнения задачи, процент успешности Claude снижается — подобно известным бенчмаркам, измеряющим самые длительные задачи, которые ИИ может надёжно выполнять.Подверженность профессий влиянию ИИ выглядит иначе с учётом процента успешности Мы также используем примитив процента успешности для лучшего понимания подверженности профессий влиянию ИИ, рассчитывая долю каждой профессии, которую Claude может выполнять, взвешивая охват задач как по проценту успешности, так и по важности каждой задачи в рамках профессии. Для некоторых профессий, таких как операторы ввода данных и архитекторы баз данных, Claude демонстрирует компетентность в значительной части работы.Claude используется для задач более высокой квалификации, чем в экономике в целом Задачи, которые мы наблюдаем при использовании Claude, как правило, требуют более высокого уровня образования, чем задачи в экономике в целом. Если предположить, что задачи с поддержкой ИИ сокращаются как доля обязанностей работника, их удаление оставит менее квалифицированную работу. Однако такое простое вытеснение задач не затронет «белых воротничков» одинаково — для одних профессий оно убирает наиболее квалифицированные задачи, для других — наименее квалифицированные. Без задач, которые, как мы наблюдаем, выполняет Claude, турагенты испытали бы деквалификацию, поскольку сложная работа по планированию уступает место рутинной покупке билетов и сбору платежей. Управляющие недвижимостью, напротив, испытали бы повышение квалификации, поскольку бухгалтерские задачи уступают место переговорам по контрактам и управлению заинтересованными сторонами.
Новое окно для понимания влияния ИИ на экономику
Эти результаты открывают новое окно в то, как ИИ в настоящее время влияет на экономику. Знание процента успешности задач даёт более точную картину того, какие задачи могут быть автоматизированы, насколько затронуты определённые профессии и как изменится производительность труда. Измерение различий в производительности в зависимости от уровня образования пользователей проливает свет на эффекты неравенства.
Действительно, тесная связь между уровнями образования во вводных данных и ответах сигнализирует о том, что страны с более высоким уровнем образования могут быть лучше подготовлены к извлечению выгоды из ИИ, независимо от одних лишь показателей внедрения.
Цель этой публикации данных — дать возможность исследователям и широкой общественности лучше понять экономические последствия ИИ и изучить способы, которыми эта трансформационная технология уже оказывает влияние.
Глава 1: Что изменилось с момента нашего прошлого отчёта
Обзор
Поскольку возможности передовых моделей ИИ стремительно улучшаются, а внедрение происходит быстро, важно регулярно оценивать изменения в том, как люди и компании используют такие системы — и что это использование означает для экономики в целом.1
В этой главе мы анализируем, как паттерны использования и распространения Claude изменились с августа по ноябрь 2025 года, непосредственно перед выпуском Opus 4.5. Мы делаем четыре наблюдения:
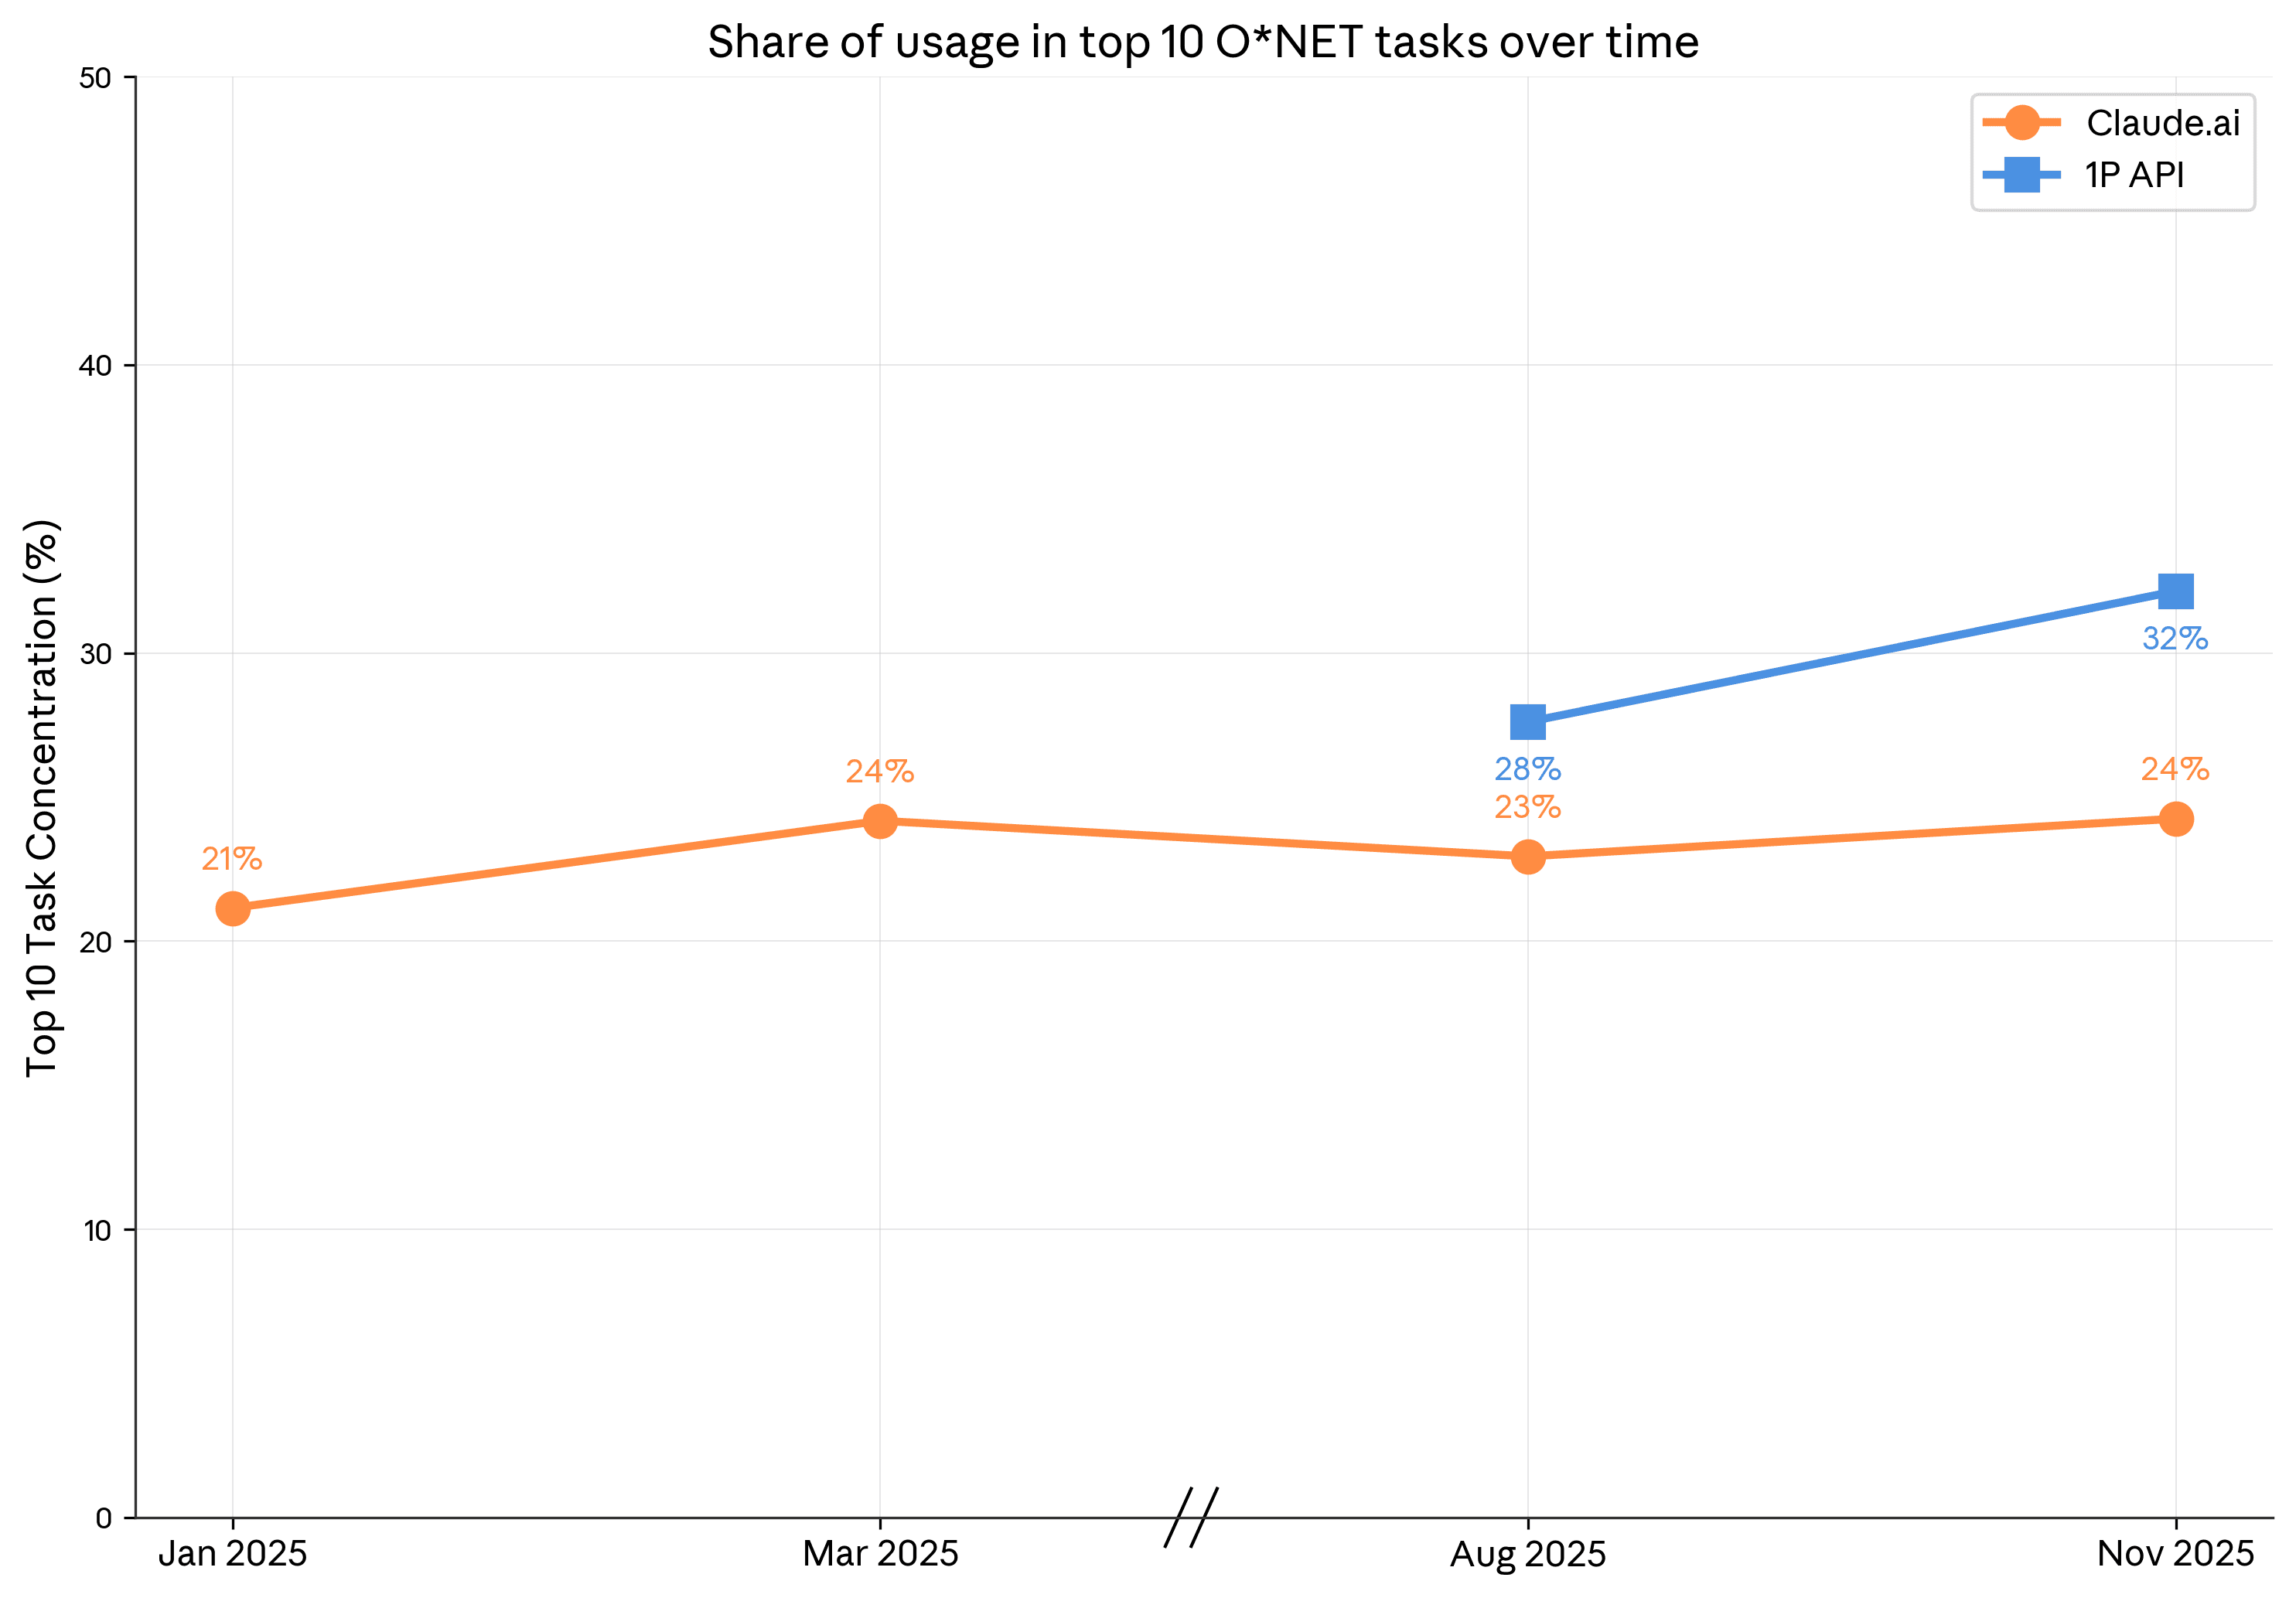
Использование остаётся высоко сконцентрированным по задачам: Десять самых распространённых задач составляют 24% наблюдаемого использования на Claude.ai — рост с 23% в нашем прошлом отчёте. Для корпоративных клиентов собственного (1P) API концентрация по задачам выросла более заметно: десять самых распространённых задач теперь составляют 32% трафика — рост с 28% в прошлом отчёте.Аугментация вновь более распространена, чем автоматизация, на Claude.ai: В нашем предыдущем отчёте мы отмечали, что автоматизированное использование превысило аугментированное на Claude.ai, что, возможно, отражает как улучшение возможностей, так и большее знакомство пользователей с LLM. Данные за ноябрь 2025 года указывают на широкий сдвиг обратно к аугментированному использованию на Claude.ai: доля диалогов, классифицированных как аугментация, выросла на 5 п.п. до 52%, а доля автоматизации снизилась на 4 п.п. до 45%.2 Изменения продукта в этот период — включая возможности создания файлов, постоянную память и Skills для настройки рабочих процессов — могли сместить паттерны использования в сторону более совместных взаимодействий с участием человека.Внутри США штаты с более низким использованием демонстрируют относительно более быстрый рост внедрения Внутри США использование на душу населения по-прежнему во многом определяется тем, насколько рабочая сила соответствует общим паттернам использования Claude: например, штаты с большей долей работников в компьютерных и математических профессиях, как правило, имеют более высокое использование. Действительно, пять ведущих штатов США составляют почти половину (50%) всего использования, хотя представляют лишь 38% населения трудоспособного возраста. Тем не менее есть ранние признаки быстрой региональной конвергенции во внедрении: использование выросло относительно быстрее в штатах, которые имели более низкое использование в нашем прошлом отчёте. Если эта тенденция сохранится, использование на душу населения выровнялось бы по стране за 2–5 лет — темп распространения примерно в 10 раз быстрее, чем распространение экономически значимых технологий XX века.3 Хотя это согласуется с быстрым внедрением и распространением ИИ, эта оценка сопряжена с неопределённостью, поскольку основана на изменениях, наблюдавшихся за трёхмесячный период. Распространение может в конечном счёте происходить медленнее в предстоящие месяцы и годы.Глобальное использование не демонстрирует признаков усиления или ослабления региональной конвергенции В глобальном масштабе использование Claude на душу населения — как его отражает индекс Anthropic AI Usage Index (AUI) — остаётся крайне неравномерным и сильно коррелирует с ВВП. Эти разрывы стабильны: мы не видим свидетельств того, что страны с низким использованием догоняют или что страны с высоким использованием отрываются.
Изменяющиеся паттерны использования по задачам и связанным профессиям
Несмотря на впечатляющий диапазон возможностей передовых LLM, релевантных для каждого аспекта современной экономики, использование Claude остаётся очень сконцентрированным среди небольшого числа задач. По сравнению с периодом почти годовой давности, потребительское использование на Claude.ai стало немного более сконцентрированным: доля диалогов, отнесённых к десяти наиболее распространённым задачам O*NET, составила 24% в ноябре 2025 года — на 1 п.п. выше, чем в августе, и рост с 21% в январе 2025 года. Самая распространённая задача в ноябре 2025 года — модификация программного обеспечения для исправления ошибок — одна составила 6% использования.
В нашем прошлом отчёте Anthropic Economic Index мы начали отслеживать паттерны бизнес-внедрения, изучая использование Claude среди клиентов 1P API. Десять самых распространённых задач выросли с 28% записей API в августе до 32% в ноябре. Рост концентрации среди небольшого набора задач свидетельствует о том, что приложения с наибольшей ценностью продолжают генерировать непропорционально высокую экономическую отдачу, даже несмотря на то, что модели стали более способными в более широком диапазоне задач. Как и на Claude.ai, самой распространённой задачей среди клиентов API была модификация программного обеспечения для исправления ошибок, на которую приходилась каждая десятая запись.
Действительно, задачи из области компьютерных и математических наук — такие как модификация программного обеспечения для исправления ошибок — продолжают доминировать в общем использовании Claude, составляя треть диалогов на Claude.ai и почти половину трафика 1P API. Такое доминирование ослабло на Claude.ai: доля диалогов на Claude.ai, отнесённых к таким (преимущественно) связанным с кодингом задачам, снизилась с пикового значения 40% в марте 2025 года до 34% в ноябре 2025 года. В то же время доля записей, отнесённых к компьютерным и математическим задачам, в трафике 1P API немного выросла — с 44% в августе до 46% в ноябре 2025 года (Рисунок 1.2).
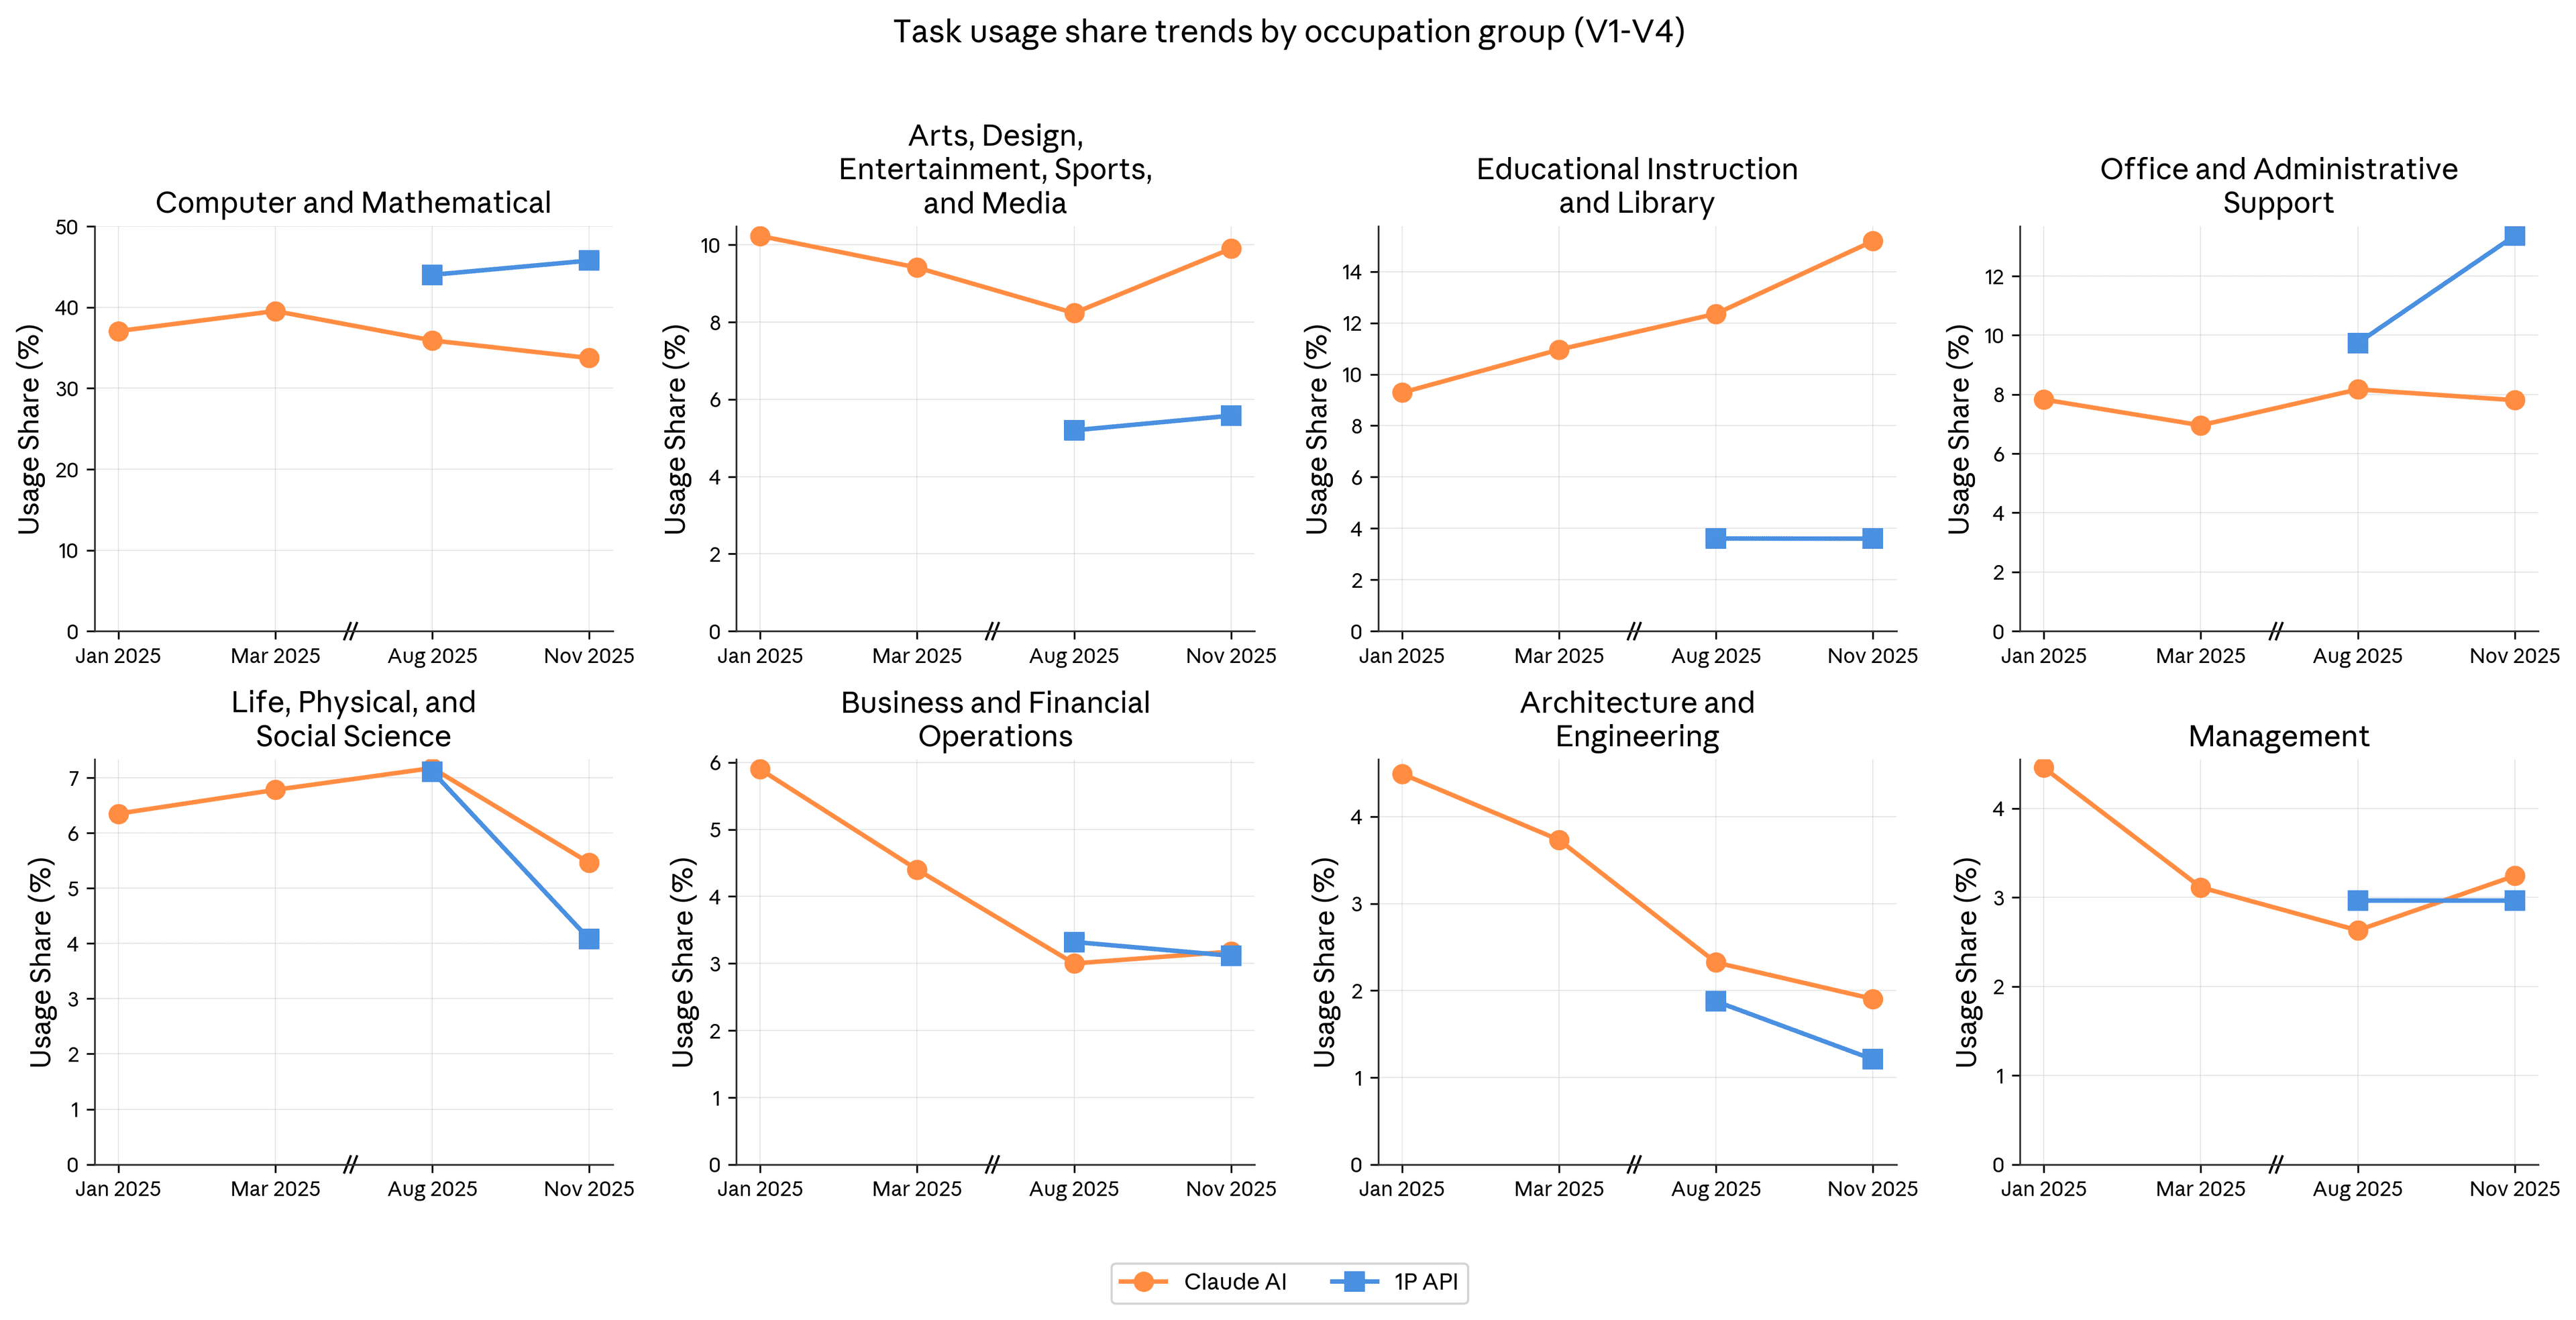
Второй по величине категорией использования Claude.ai в ноябре 2025 года стала категория «Образовательное обучение и библиотечное дело». Она в основном соответствует помощи с учебными заданиями и проверкой, а также разработке учебных материалов. Такое использование неуклонно росло с нашего первого отчёта — с 9% диалогов на Claude.ai в январе 2025 года до 15% в ноябре.
Доля использования Claude.ai для задач в области искусства, дизайна, развлечений, спорта и медиа выросла между августом и ноябрём 2025 года, поскольку Claude использовался во всё большей доле диалогов для задач написания текстов, прежде всего корректуры и написания и доработки художественных произведений. Этот скачок в распространённости задач, связанных с дизайном и письмом, обратил вспять устойчивое снижение в предыдущих отчётах. Как для Claude.ai, так и для клиентов API произошло снижение доли диалогов/записей, в которых Claude использовался для задач, связанных с науками о жизни, физическими и социальными науками.
Пожалуй, наиболее заметным событием для клиентов API стал рост доли записей, связанных с задачами офисной и административной поддержки, которая выросла на 3 п.п. в августе до 13% в ноябре 2025 года. Поскольку использование API доминирует в автоматизации, это свидетельствует о том, что предприятия всё чаще используют Claude для автоматизации рутинных бэк-офисных процессов — таких как управление электронной почтой, обработка документов, управление взаимоотношениями с клиентами и планирование.4
Аугментация снова доминирует на Claude.ai
Влияние ИИ на экономику зависит не только от задач, для которых используется Claude, но и от способа, которым пользователи получают доступ к возможностям модели и используют их. С нашего первого отчёта мы классифицируем диалоги по одному из пяти типов взаимодействия, которые группируем в две более широкие категории: автоматизация и аугментация.5
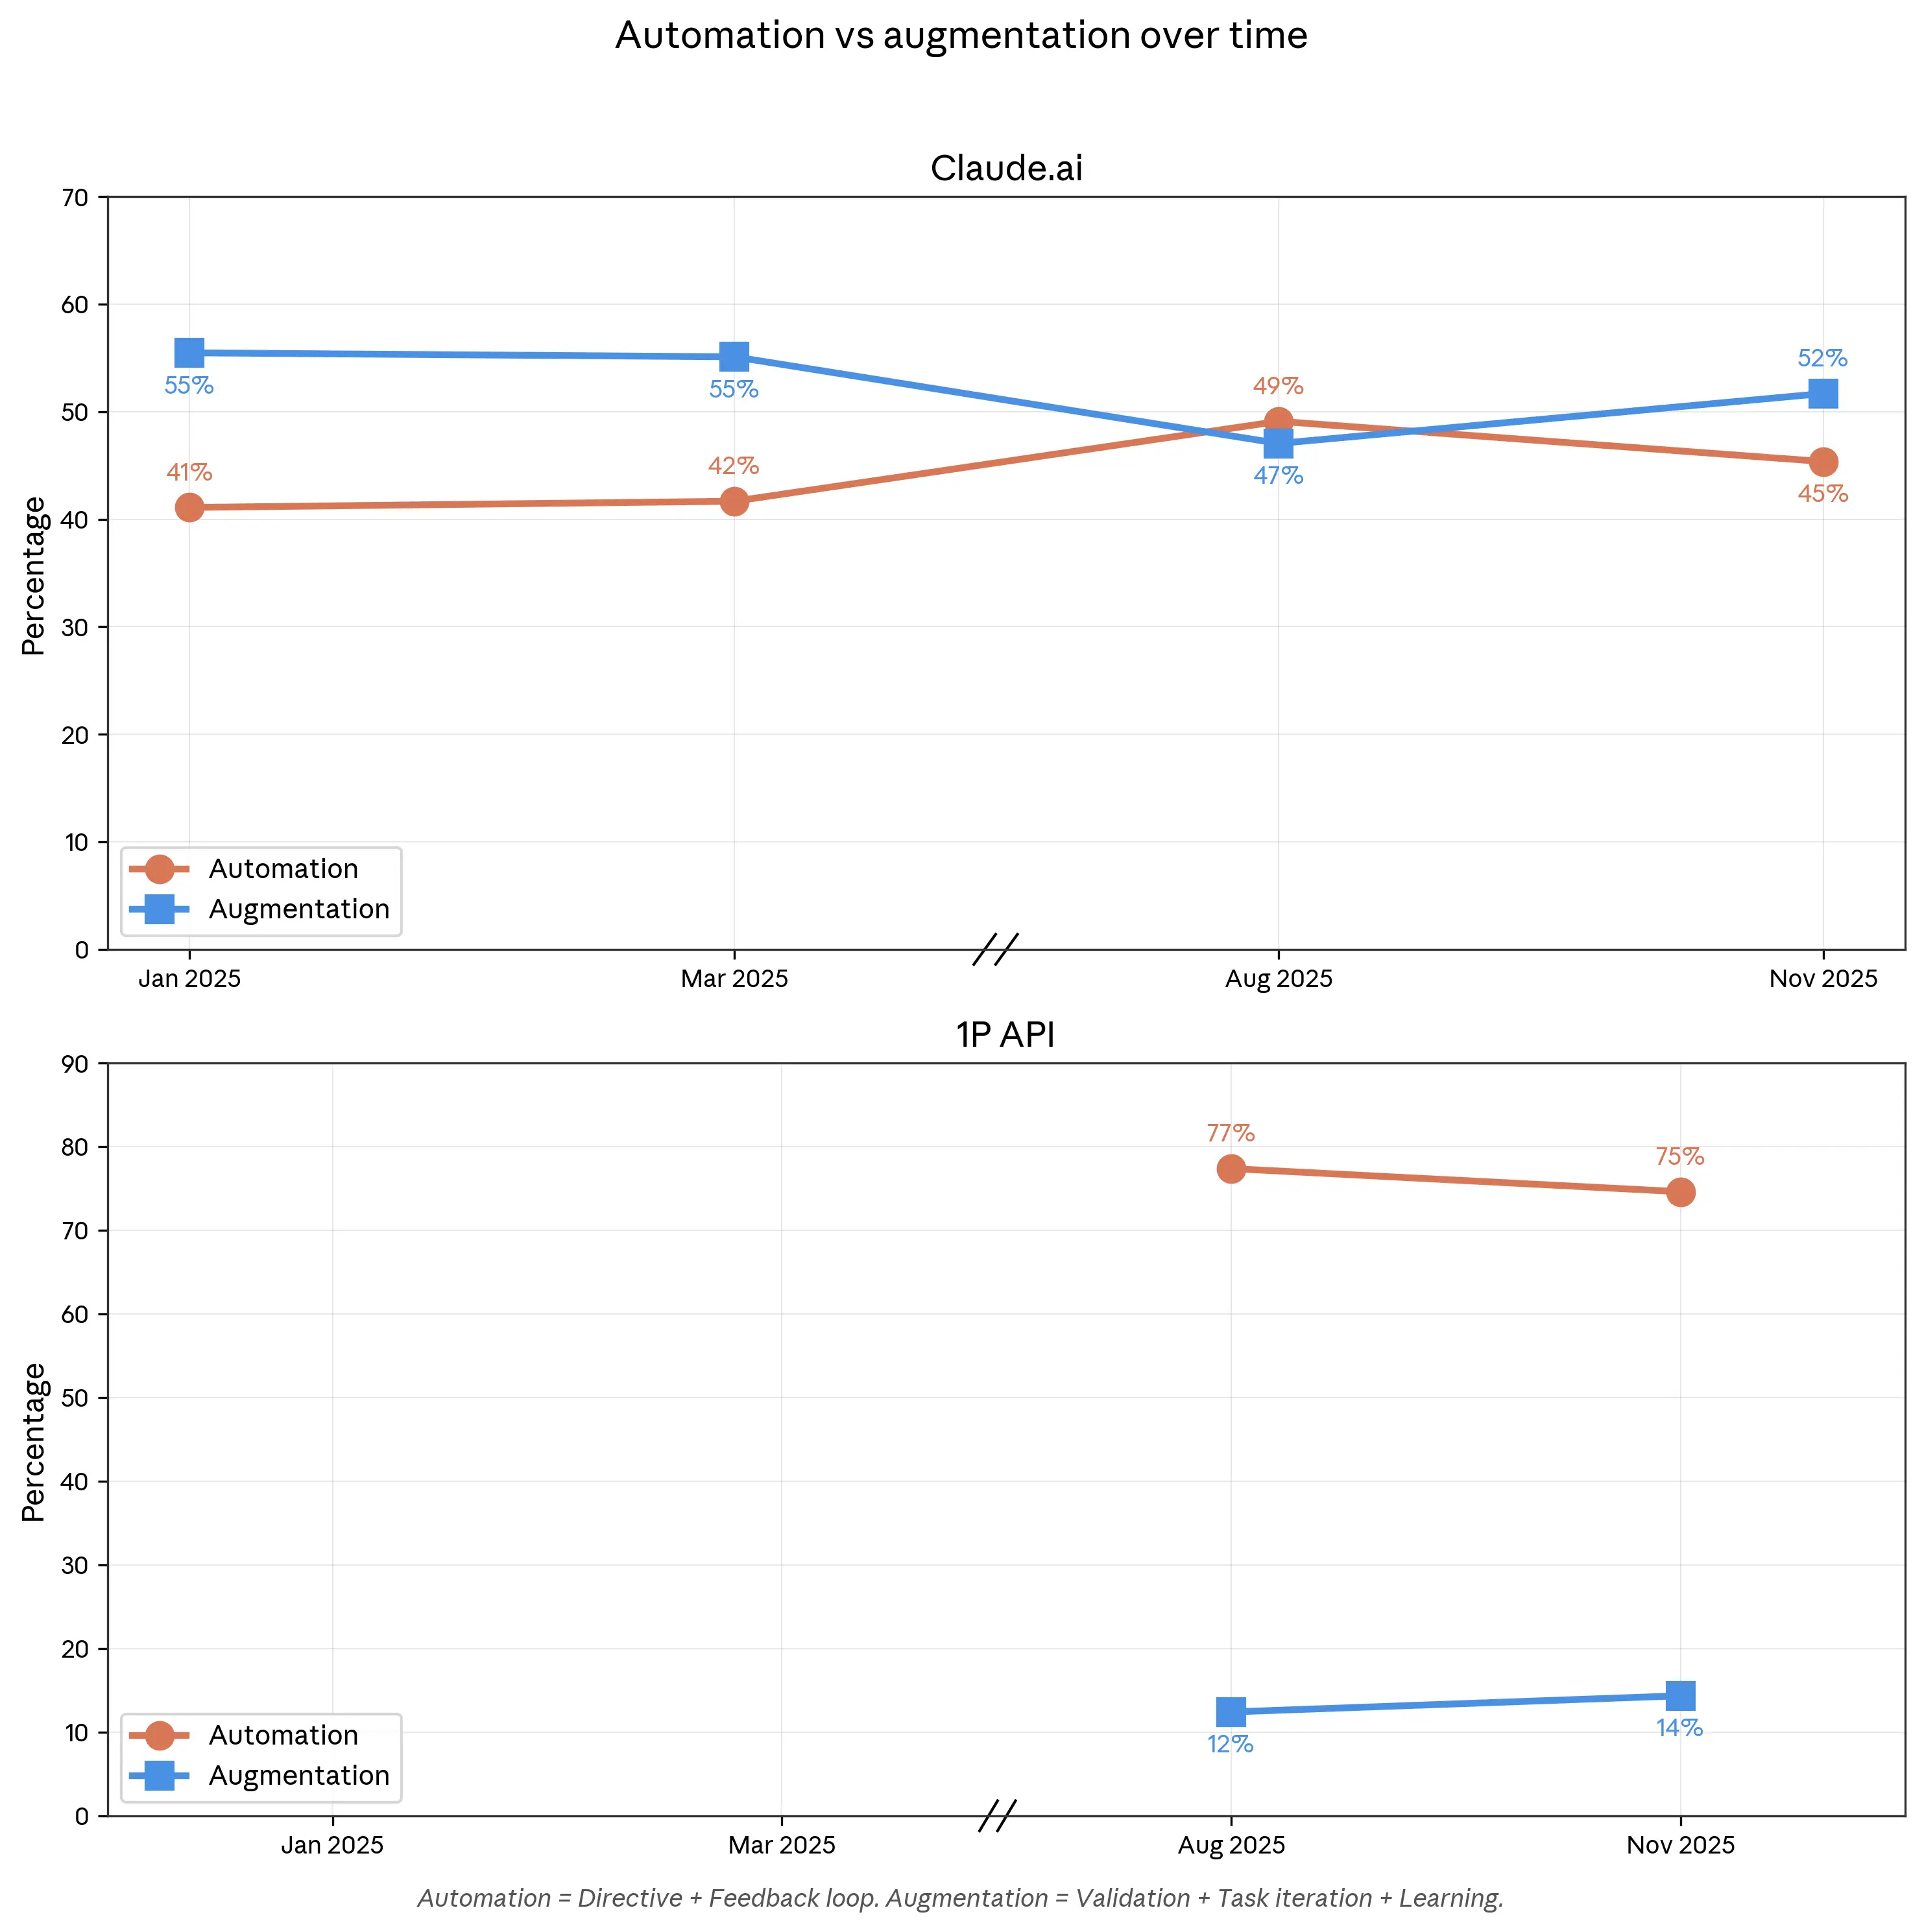
Рисунок 1.3 показывает, как автоматизированное и аугментированное использование эволюционировало с момента, когда мы впервые начали собирать эти данные год назад. В январе 2025 года аугментированное использование Claude доминировало: 56% диалогов были классифицированы как аугментация по сравнению с 41% автоматизации.6 В августе 2025 года больше диалогов было классифицировано как автоматизированные по сравнению с аугментированными.
Это было заметным событием, поскольку свидетельствовало о том, что быстрое улучшение возможностей моделей и функциональности платформы совпало с тем, что пользователи всё чаще полностью делегировали задачи Claude. Это было особенно заметно в «директивном» режиме совместной работы, который далее группируется как автоматизация. Директивные диалоги — это те, в которых пользователи ставят Claude задачу и он выполняет её с минимальным обменом сообщениями. С января 2025 по август 2025 года доля таких директивных диалогов выросла с 27% до 39%.7
Три месяца спустя доля директивных диалогов снизилась на 7 п.п. до 32% в ноябре 2025 года, а аугментация вновь стала более распространённой на Claude.ai, чем автоматизация. Тем не менее доля автоматизации всё ещё была повышена по сравнению с периодом почти годовой давности, когда мы впервые начали отслеживать этот показатель, что свидетельствует о том, что основной тренд по-прежнему направлен в сторону большей автоматизации, даже если августовский всплеск переоценил, насколько быстро это происходило.
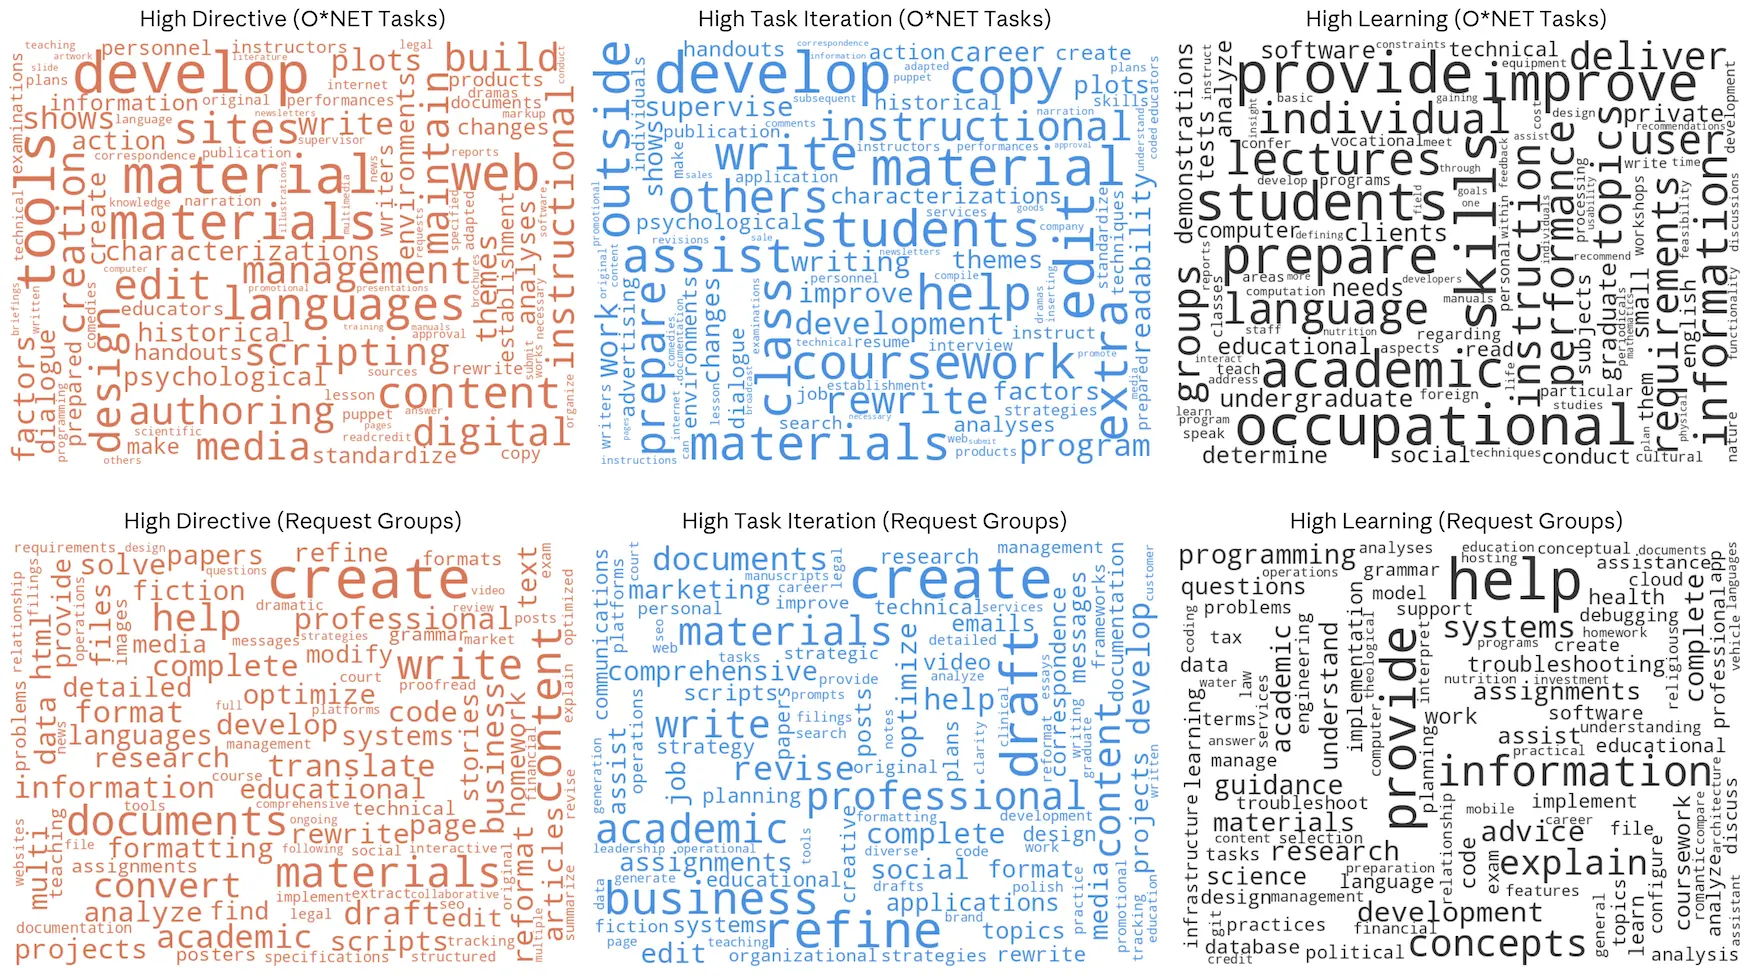
Хотя мы наблюдаем некоторые свидетельства сдвига в сторону использования мягких навыков на Claude.ai — дизайн, менеджмент и образование теперь занимают более высокие позиции — сдвиг обратно к аугментированному использованию в ноябре был широким (Рисунок 1.4). Рост аугментированного использования был обусловлен главным образом итеративной работой пользователей с Claude над задачами («итерация задач»), а не просьбами объяснить концепции («обучение»). См. Рисунок 1.5 для наиболее частых слов, ассоциированных с тремя наиболее распространёнными режимами взаимодействия по задачам O*NET и описаниями запросов к Claude, сделанными снизу вверх.
Устойчивая региональная концентрация
В нашем предыдущем отчёте мы представили индекс Anthropic AI Usage Index (AUI) — показатель того, является ли Claude сверх- или недопредставленным в данной географии относительно размера её населения трудоспособного возраста. AUI определяется как

AUI выше 1 означает, что страна использует Claude интенсивнее, чем предсказывало бы одно лишь её население, тогда как AUI ниже 1 указывает на использование ниже ожидаемого. Например, Дания имеет AUI 2,1 — это означает, что её жители используют Claude примерно вдвое чаще, чем можно было бы предположить исходя из её доли в мировом населении трудоспособного возраста.
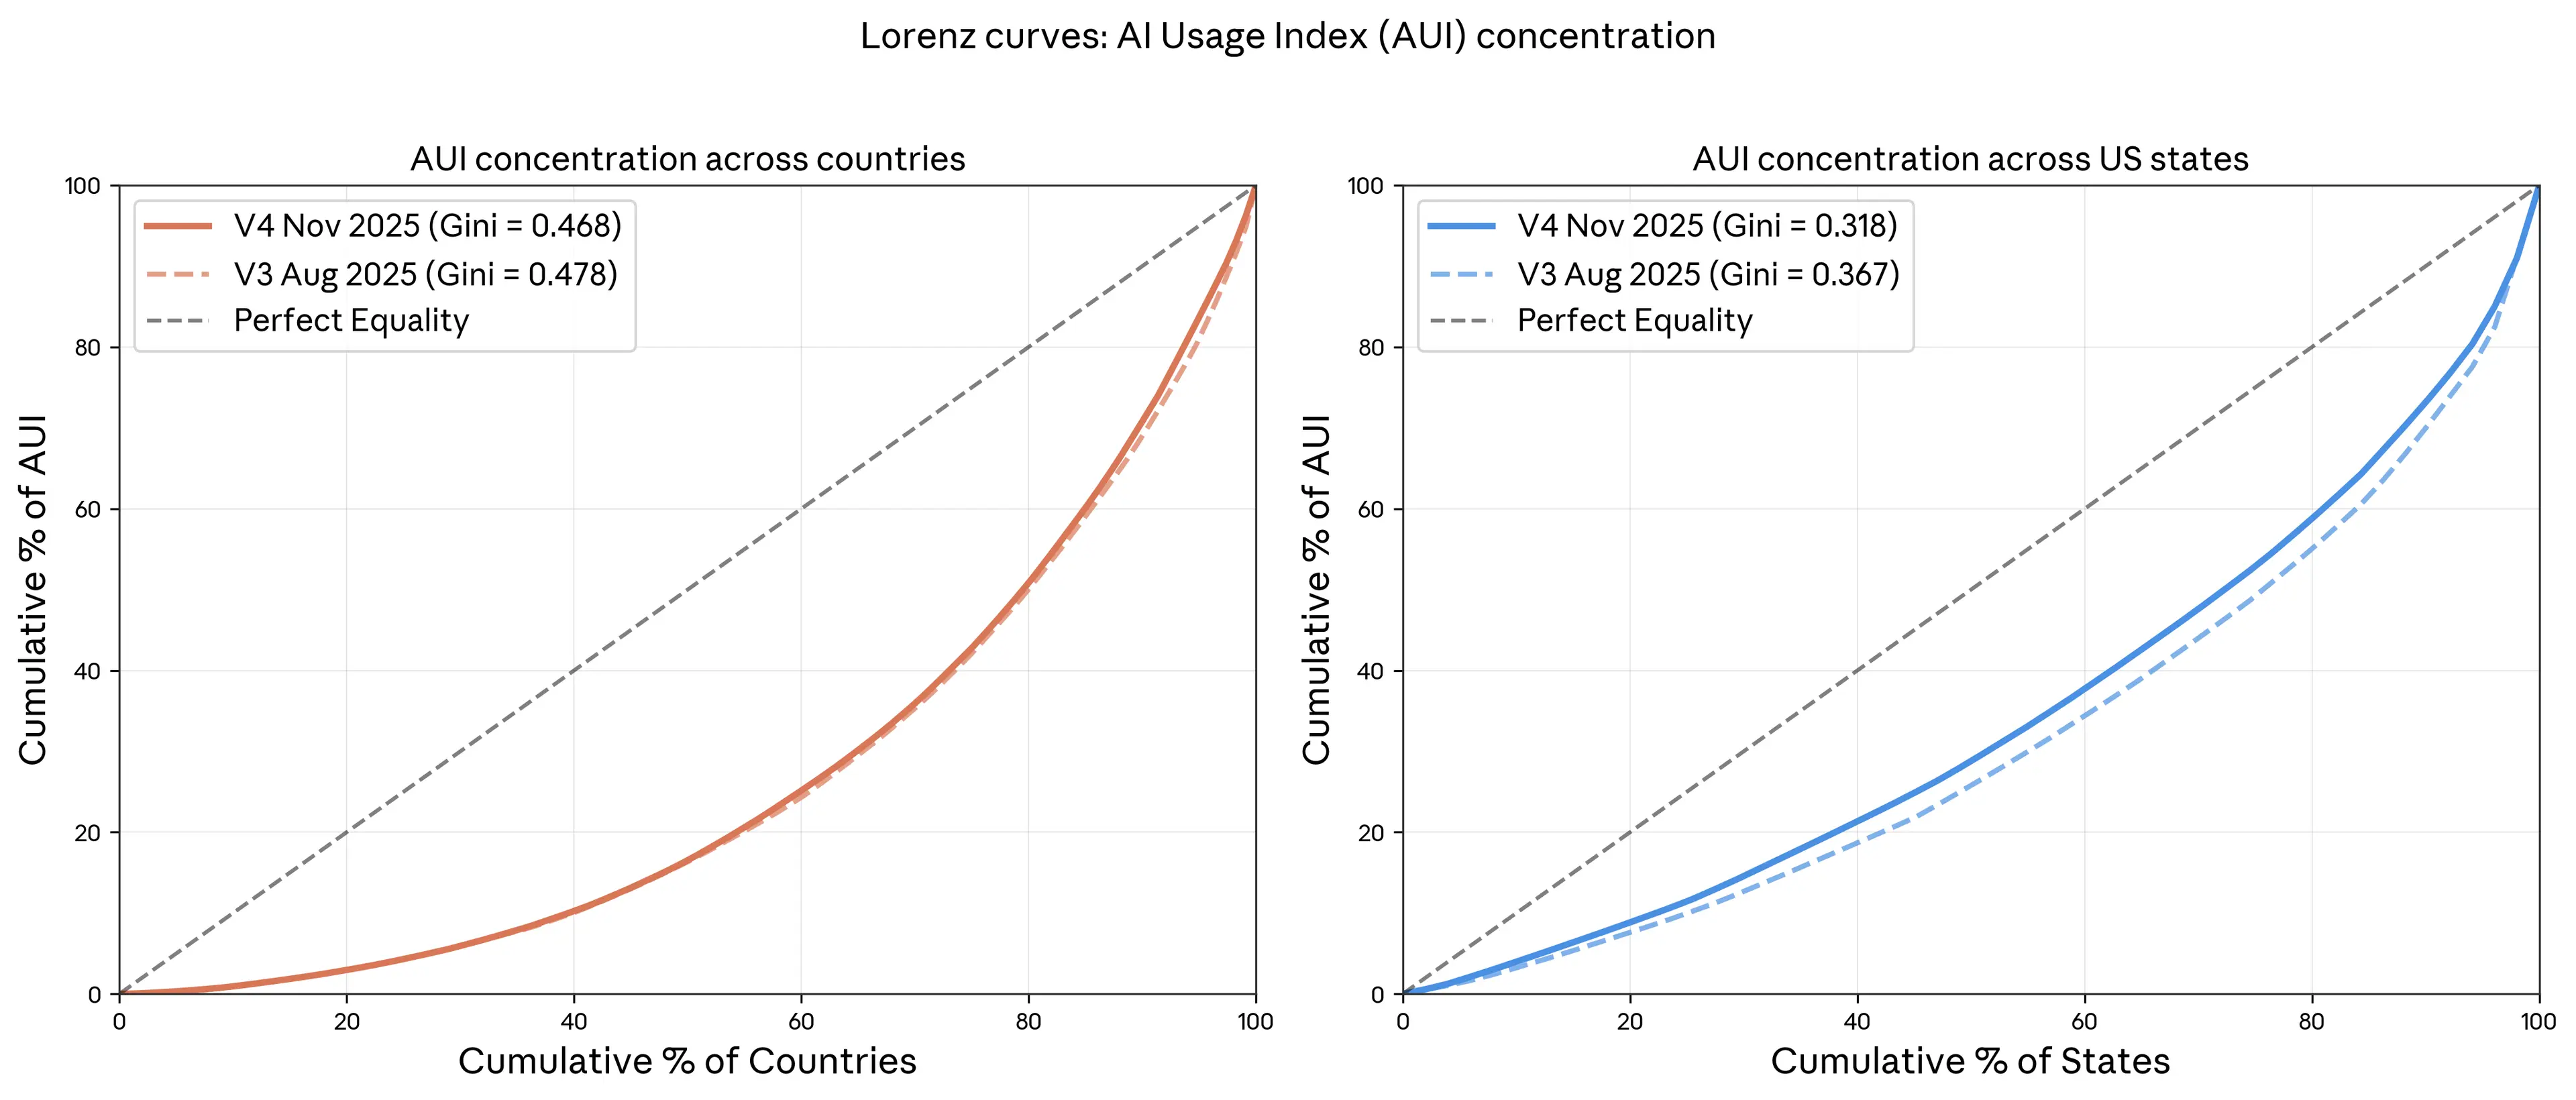
Ключевой факт об использовании Claude в мире состоит в том, что оно географически сконцентрировано: небольшое число стран составляет непропорционально большую долю использования. С глобальной точки зрения между августом и ноябрём 2025 года в этом отношении мало что изменилось. Действительно, левая панель Рисунка 1.6 показывает, что концентрация AUI по странам была практически неизменной между нашим прошлым и настоящим отчётами.
Напротив, использование стало более равномерно распределённым между штатами США с августа по ноябрь 2025 года: коэффициент Джини — стандартная мера равенства — снизился с 0,37 до 0,32. Хотя важно проявлять осторожность в интерпретации краткосрочных изменений, это относительно большое движение к совершенному равенству, при котором AUI равен 1 для всех штатов, а коэффициент Джини равен 0. Если коэффициент Джини для США снова будет снижаться на 0,05 каждые три месяца, то паритет использования будет достигнут примерно через два года.
Что формирует паттерны использования внутри США и по всему миру? В нашем предыдущем отчёте мы подчёркивали ключевую роль различий в доходах на глобальном уровне: вариация в использовании Claude по странам в значительной мере объясняется вариацией ВВП на душу населения. В главе 3 мы возвращаемся к важности дохода в формировании не только интенсивности использования, но и паттернов использования по всему миру.
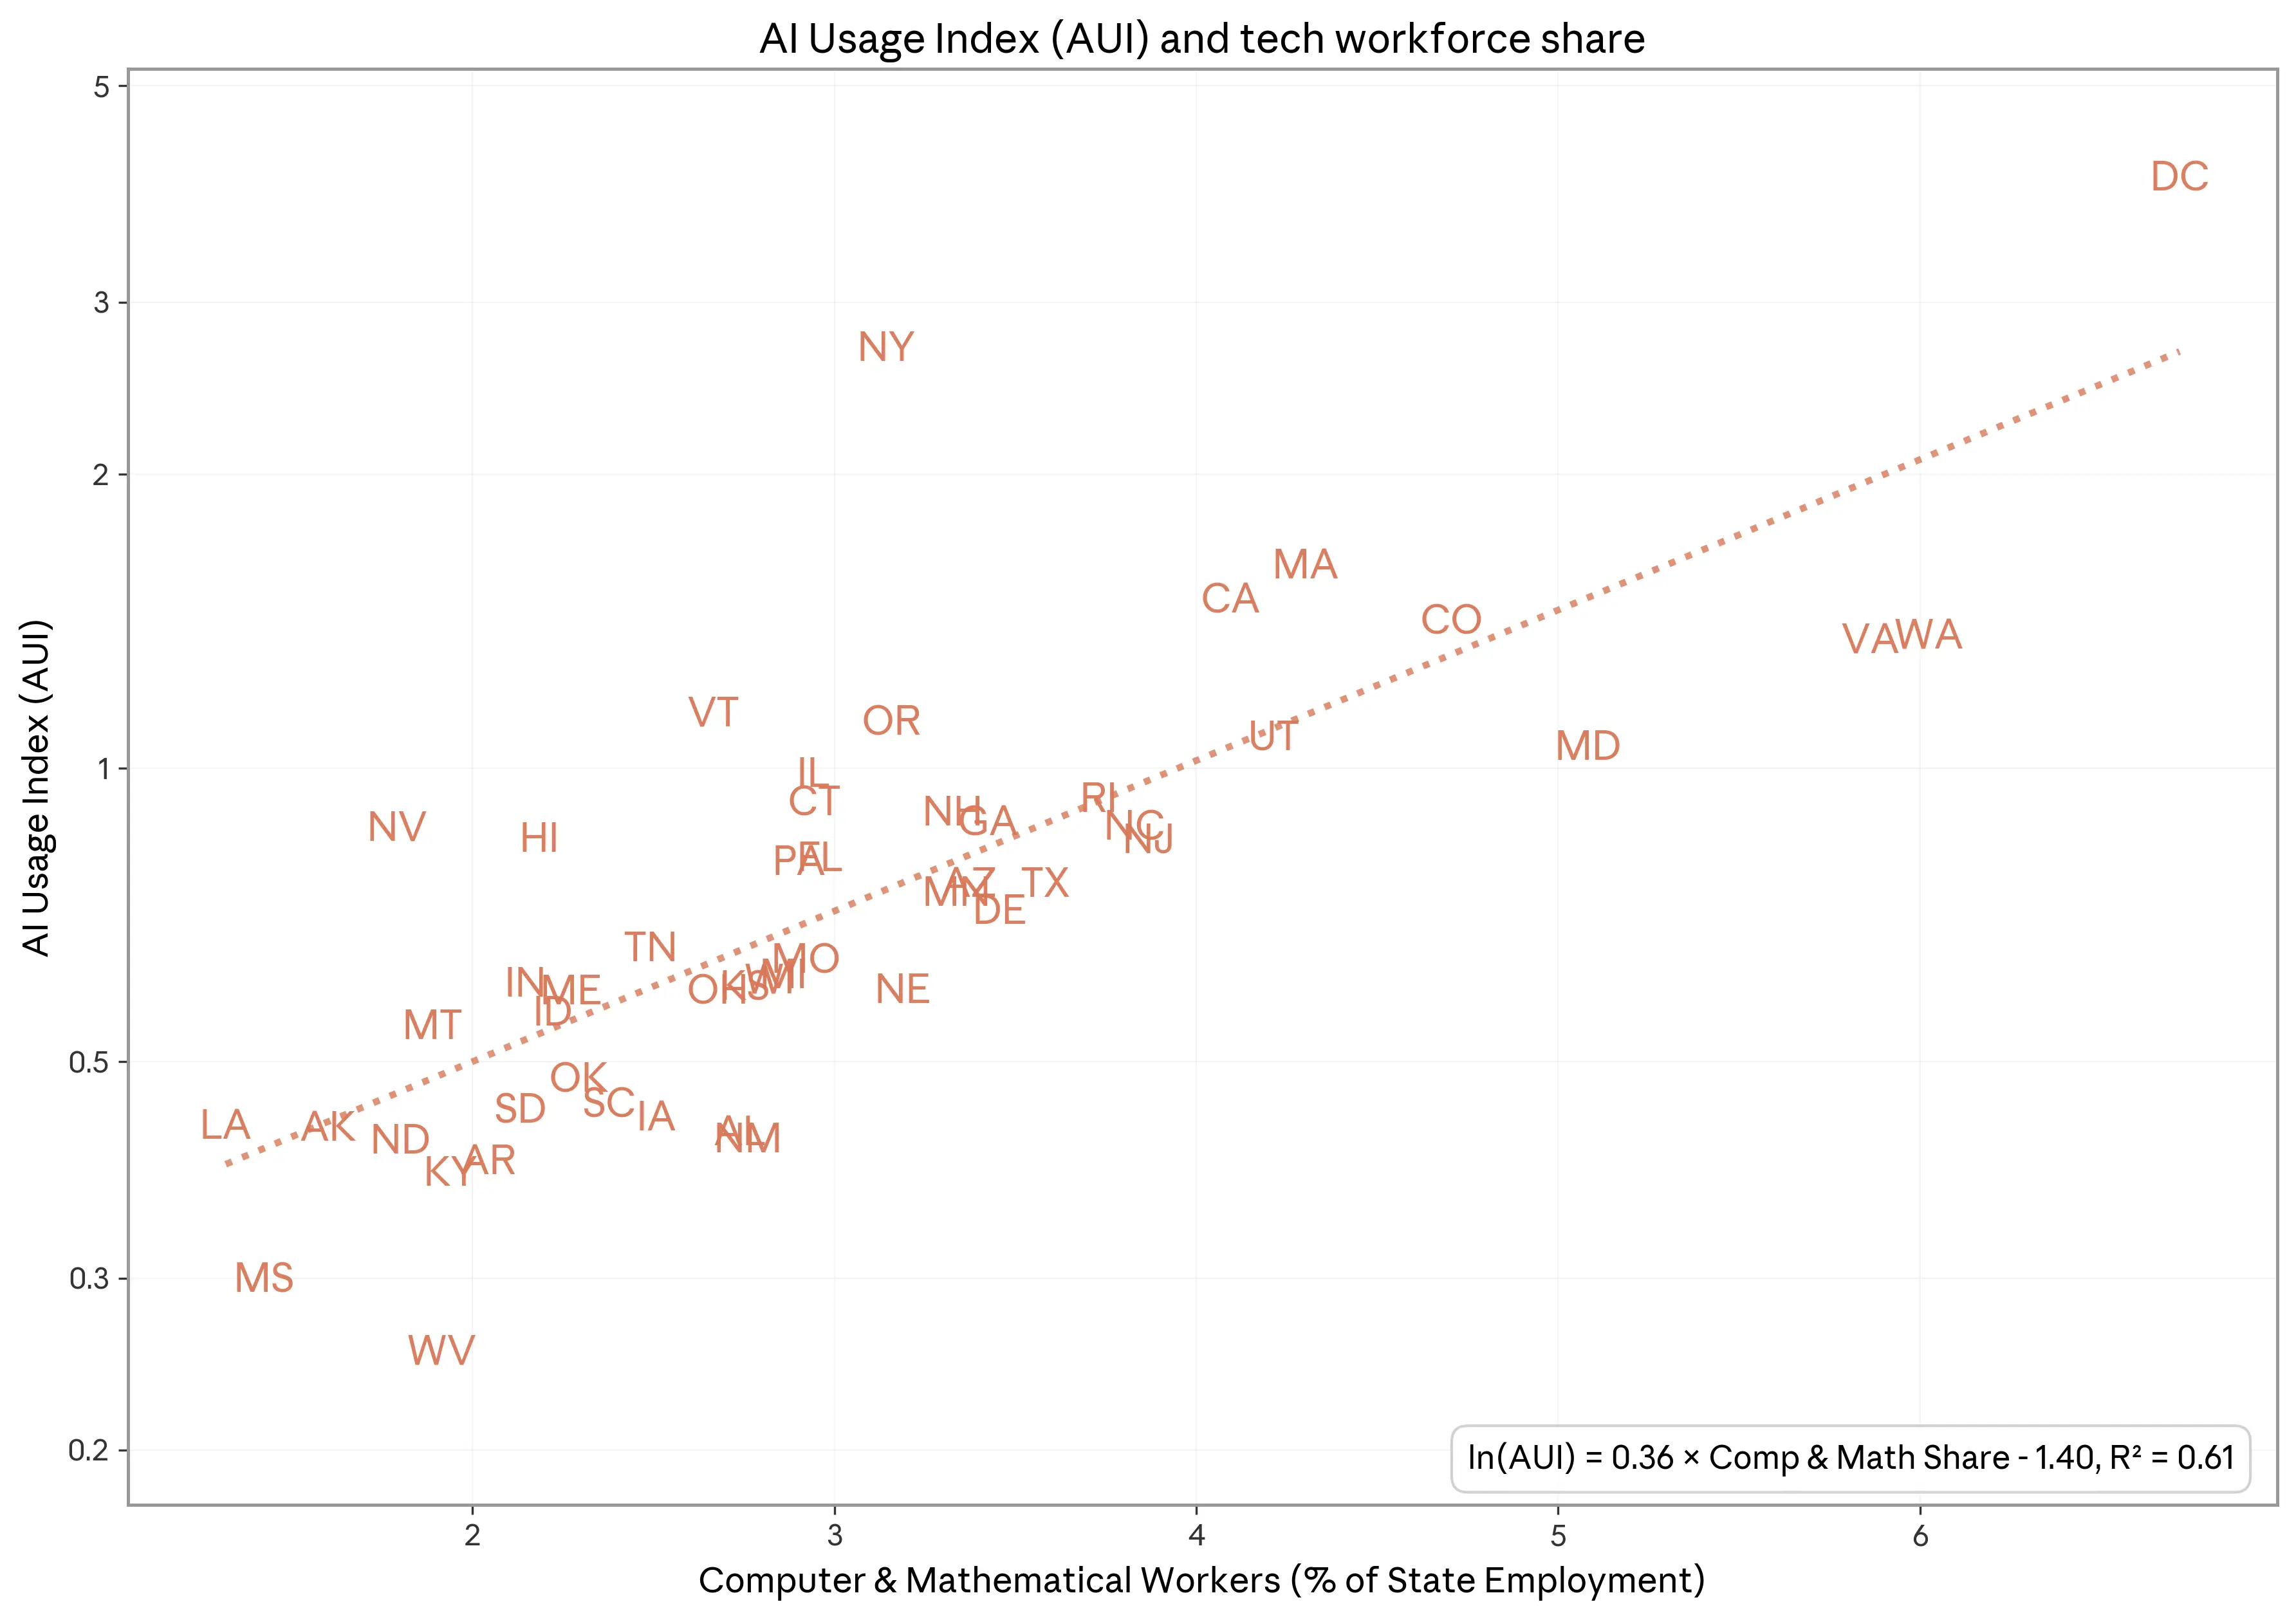
Внутри США доход менее явно является предиктором использования. Вместо этого наиболее важным представляется состав рабочей силы каждого штата и то, насколько рабочая сила соответствует возможностям Claude, отражённым в использовании на уровне задач. Штаты с более высокой долей работников в компьютерных и математических профессиях — такие как Вашингтон, округ Колумбия, Вирджиния и Вашингтон — как правило, имеют более высокое использование на душу населения. Количественно каждое увеличение на 1% доли таких технических работников в штате связано с 0,36% более высоким использованием на душу населения (Рисунок 1.7). Только это объясняет почти две трети межштатной вариации AUI.
Хотя мы интуитивно ожидали бы более высокого использования Claude в штатах с большим количеством технических работников, этот паттерн действует более широко: использование на душу населения выше в штатах с большим числом работников в профессиях, где использование Claude сверхпредставлено по сравнению с рабочей силой США (например, искусство, дизайн, развлечения, спорт и медиа), или с относительно меньшим числом работников в профессиях, где использование Claude низкое по сравнению с национальной экономикой (например, транспортировка и перемещение грузов). Это видно при расчёте дивергенции Кульбака–Лейблера (KL) между составом рабочей силы каждого штата и глобальным распределением использования Claude. Штаты с меньшей KL-дивергенцией — и, следовательно, с рабочей силой, более похожей на паттерны использования Claude — как правило, имеют более высокое использование на душу населения.
Признаки более быстрого распространения Claude в США среди штатов с низким использованием
Хотя различия в составе рабочей силы, по-видимому, играют роль в формировании регионального внедрения в США, ранние данные свидетельствуют о том, что Claude распространяется значительно быстрее, чем предсказывали бы исторические прецеденты. Экономически значимым технологиям исторически требовалось около полувека для полного распространения по территории США (Kalanyi et al., 2025). Напротив, сравнивая показатели внедрения Claude в ноябре 2025 года с данными трёхмесячной давности, мы оцениваем, что паритет во внедрении на душу населения по штатам США — измеренный по AUI — может быть достигнут в течение 2–5 лет. Эта оценка сопряжена с высокой степенью неопределённости, поскольку точность наших оценок не позволяет исключить значительно более медленные темпы распространения.
Мы получаем эту оценку через призму простой модели распространения, которую здесь кратко описываем. Мы моделируем распространение как пропорциональную конвергенцию к общему стационарному состоянию выровненного использования на душу населения, при котором каждый штат s имеет AUI, равный 1:

В рамках этой модели логарифмическое отклонение AUI от стационарного состояния (AUI = 1) сокращается на множитель β каждые три месяца, что подразумевает период полураспада ln(.5)/ln(β) кварталов. Например, при квартальных данных значение β = 0,99 подразумевает период полураспада около 17 лет. Для иллюстрации: начиная с исходного AUI, равного 2, это означает, что AUI снизится примерно до 1,4 через 17 лет и примерно до 1,1 через 50 лет. Мы принимаем β = 0,99 как разумный ориентир, поскольку он подразумевает темп распространения, аналогичный экономически значимым технологиям XX века.
Эта модель конвергенции мотивирует следующую регрессионную спецификацию8:

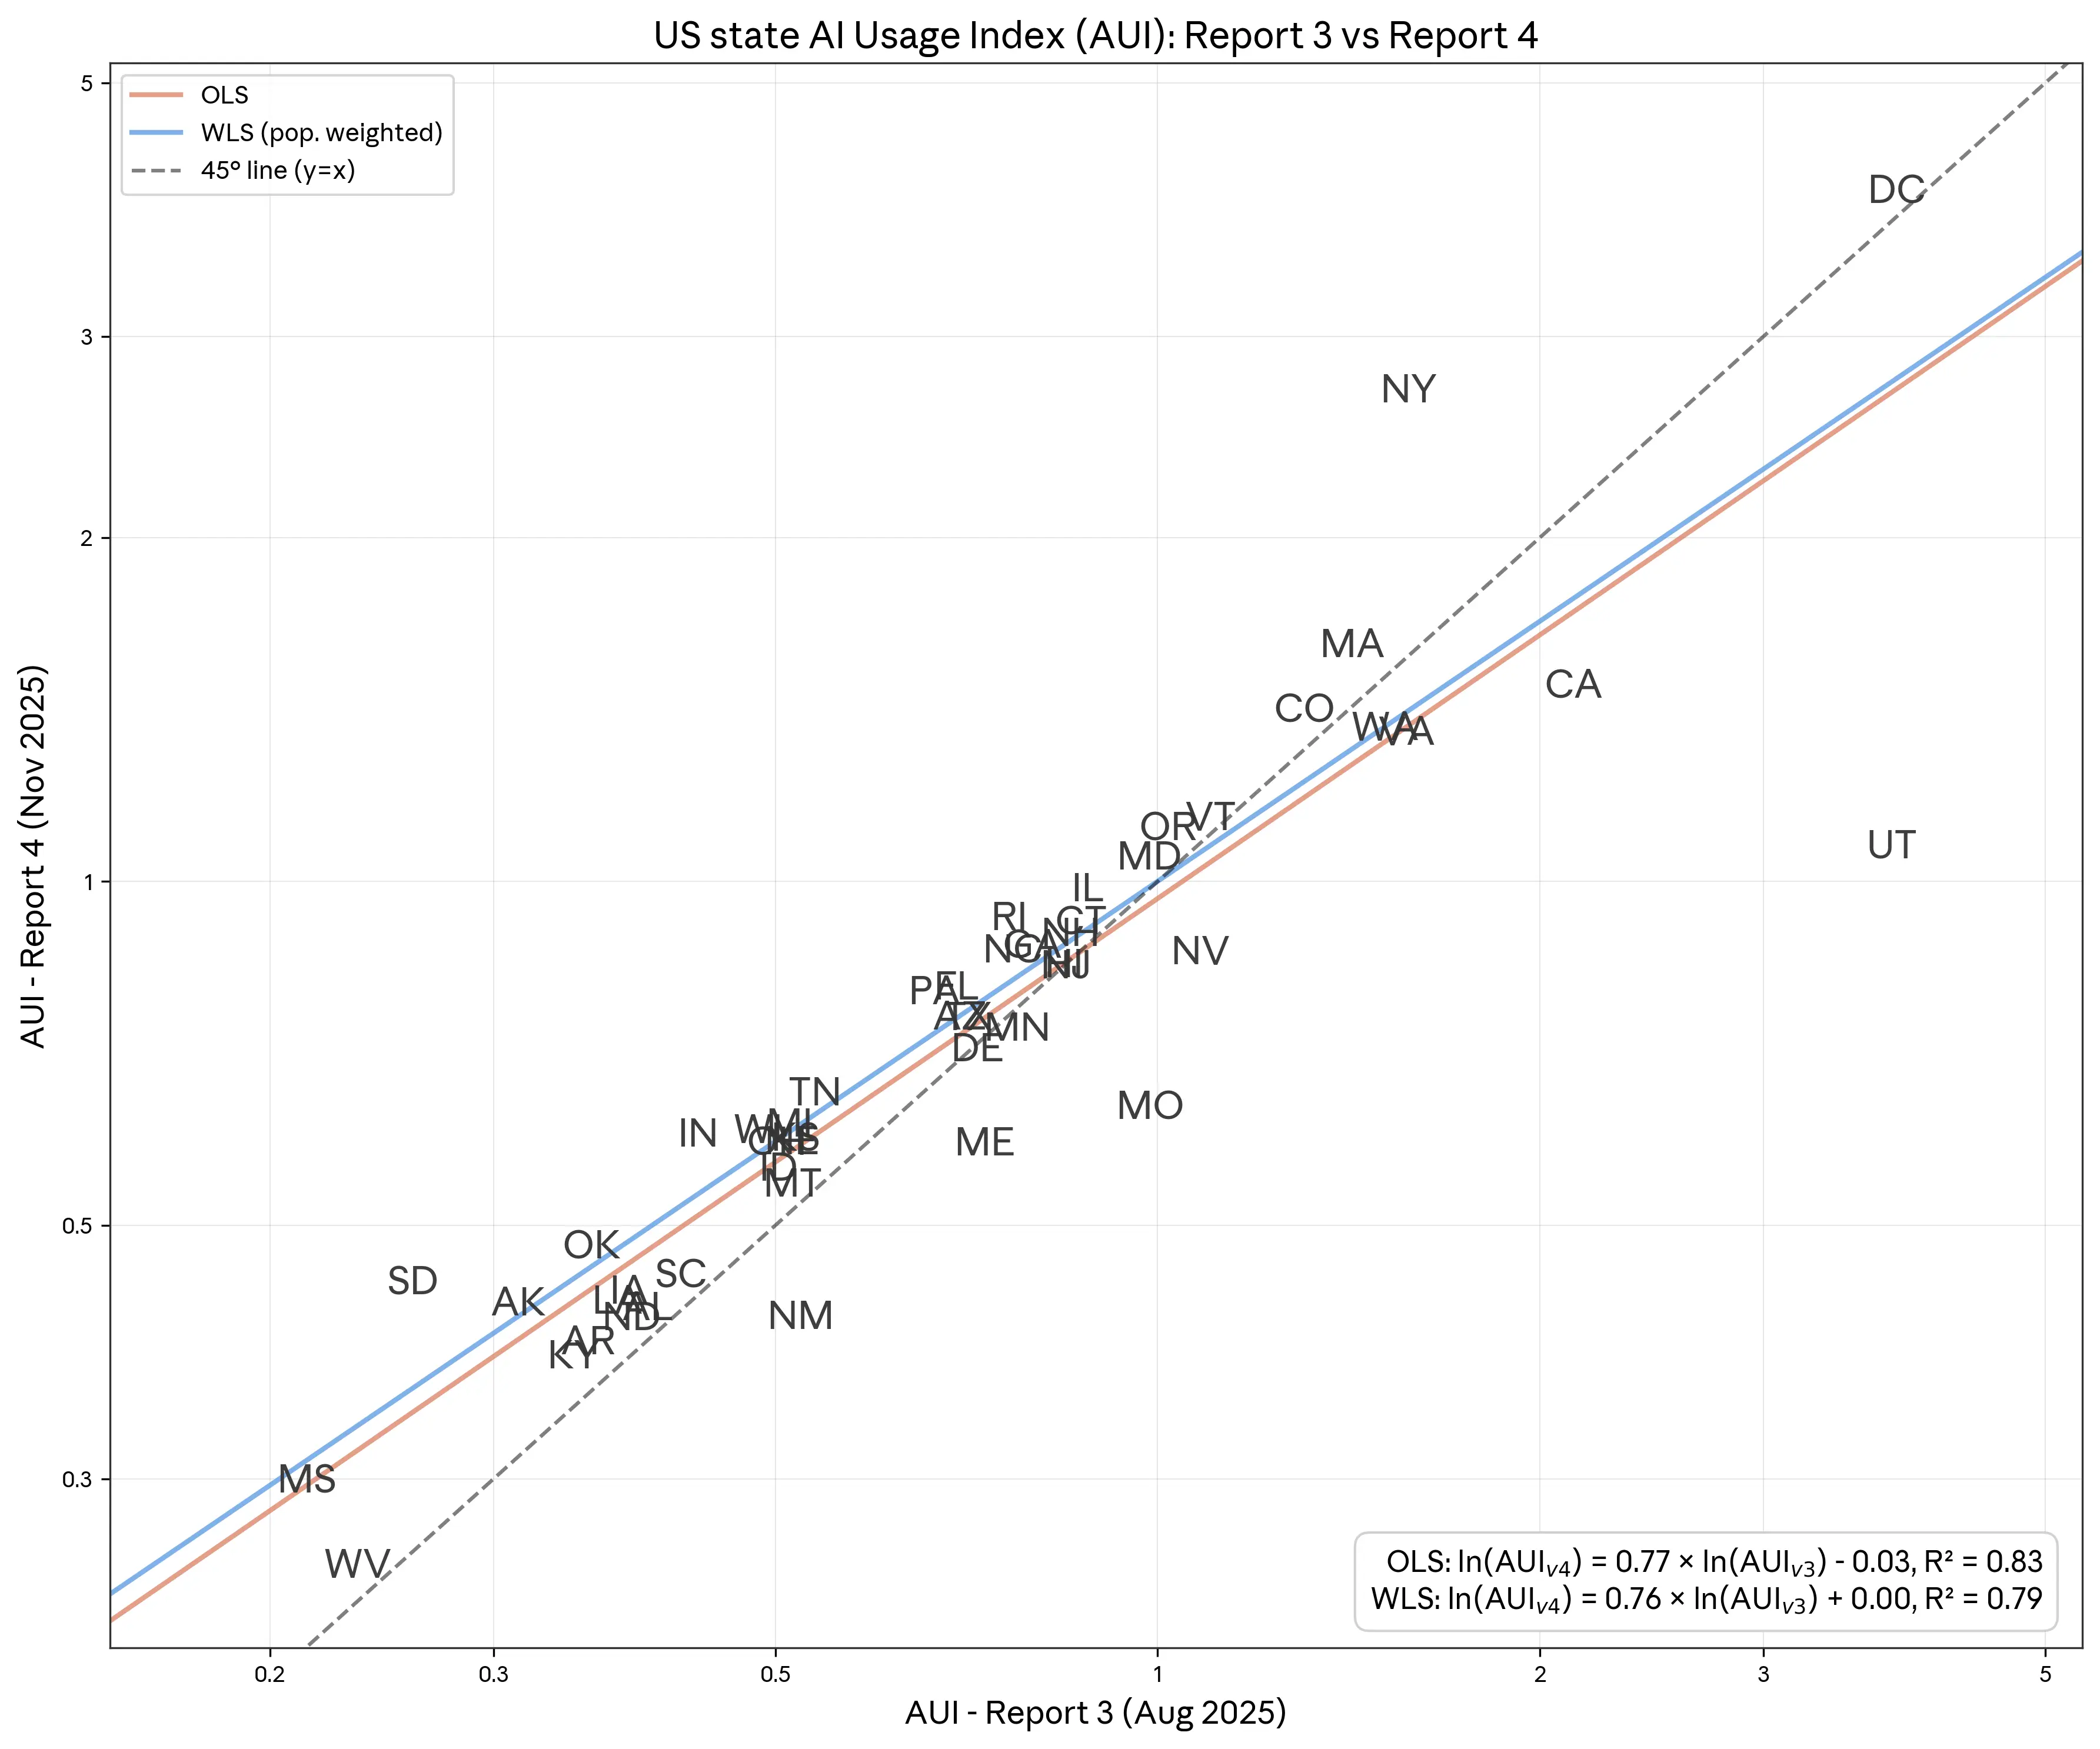
Наивная оценка этого уравнения методом обычных наименьших квадратов (OLS) даёт оценку β̂ ≈ 0,77. Взвешенный метод наименьших квадратов (WLS) с весами по рабочей силе каждого штата даёт оценку β̂ ≈ 0,76 (Рисунок 1.8). Оба значения статистически отличимы от 1 на стандартных уровнях значимости. При буквальном восприятии эти оценки подразумевают, что чуть более двух лет потребуется каждому штату, чтобы AUI закрыл большую часть разрыва до 1.
Проблема при оценке конвергенции таким способом состоит в том, что наши оценки AUI подвержены шуму выборки и другим вариациям, не связанным с распространением. Это может порождать классическое смещение ослабления: даже если AUI на самом деле не меняется, наша оценка β может оказаться существенно ниже единицы.
Для решения этой проблемы мы оцениваем модель методом двухшагового наименьших квадратов (2SLS), инструментируя логарифм AUI в августе 2025 года составом рабочей силы каждого штата, измеренным по его близости к общим паттернам использования Claude. Логика этого инструмента состоит в том, что состав рабочей силы является сильным предиктором использования Claude (релевантность), но, будучи измеренным независимо, предположительно не коррелирует с шумом выборки в наших оценках AUI (валидность). Как отмечалось выше, штаты с большим числом работников в профессиях с высоким использованием Claude действительно систематически демонстрируют более высокое использование на душу населения.
Оценки 2SLS подразумевают несколько более медленную конвергенцию: β̂ ≈ 0,89 без взвешивания и β̂ ≈ 0,86 при взвешивании по населению трудоспособного возраста каждого штата. Однако эти оценки менее точны, и только первая статистически отличима от 1 на 10%-ном уровне. Несмотря на то что оценки 2SLS подразумевают более медленную конвергенцию, чем OLS, они всё равно свидетельствуют о быстром распространении: всего четыре-пять лет для сокращения логарифмического отклонения AUI каждого штата на 90%.
Тем не менее наши оценки основаны лишь на трёх месяцах данных. И хотя спецификация 2SLS может помочь решить проблему шума выборки, значительная неопределённость сохраняется. Мы вернёмся к вопросу о темпах распространения в будущих отчётах.
1 Как и в предыдущих отчётах, весь наш анализ основан на анализе с сохранением конфиденциальности. В отчёте мы анализируем случайную выборку из 1 млн диалогов Claude.ai уровней Free, Pro и Max (мы также называем это «потребительскими данными», поскольку они в основном представляют потребительское использование) и 1 млн записей из нашего собственного (1P) API-трафика (мы также называем это «корпоративными данными», поскольку они в основном представляют корпоративное использование). Обе выборки охватывают период с 13 по 20 ноября 2025 года. Мы продолжаем управлять данными в соответствии с нашими политиками конфиденциальности и хранения данных, и наш анализ согласуется с нашими условиями, политиками и договорными соглашениями. Для данных 1P API каждая запись представляет собой пару «запрос-ответ» из нашего периода выборки, которая в некоторых случаях является серединой сессии для многоходовых взаимодействий.
2 Доля диалогов на Claude.ai, не классифицированных ни в категорию автоматизации, ни в категорию аугментации, снизилась с 3,9% до 3,0%.
3 См., например, Kalanyi et al (2025): «Во-вторых, по мере развития технологий и роста числа связанных с ними рабочих мест найм распространяется географически. Этот процесс очень медленный — полное распространение занимает около 50 лет».
4 В нашем анализе трафика 1P API снизу вверх мы видим, что Claude используется для «Генерации персонализированных B2B cold-email для продаж» (0,47%), «Анализа электронных писем и подготовки ответов на деловую переписку» (0,28%), «Создания и поддержки систем обработки счетов» (0,24%), «Классификации и категоризации электронных писем по заданным меткам» (0,23%) и «Управления планированием календаря, координацией встреч и бронированием» (0,16%).
5 На высоком уровне мы различаем автоматизацию и аугментацию как режимы использования Claude. Автоматизация охватывает паттерны взаимодействия, ориентированные на выполнение задач: Директивный: пользователи ставят Claude задачу, и он выполняет её с минимальным обменом сообщениями; Циклы обратной связи: пользователи автоматизируют задачи и предоставляют обратную связь Claude по мере необходимости; Аугментация сосредоточена на паттернах совместного взаимодействия: Обучение: пользователи спрашивают Claude об информации или объяснениях по различным темам; Итерация задач: пользователи итеративно работают над задачами совместно с Claude; Валидация: пользователи просят Claude дать обратную связь по их работе.
6 Эти режимы взаимодействия не являются взаимоисчерпывающими. В некоторых случаях Claude определяет, что выбранный диалог не соответствует ни одному из пяти режимов взаимодействия.
7 В данном отчёте мы используем Sonnet 4.5 для классификации, тогда как в нашем предыдущем отчёте Economic Index мы использовали Sonnet 4. Ранее мы обнаружили, что разные модели могут давать разные результаты классификации, хотя эти эффекты, как правило, невелики.
8 Мы включаем константу в регрессию, поскольку она должна быть равна нулю при нулевой гипотезе. Во всех наших спецификациях константа оценивается как близкая к нулю и статистически неотличимая от нуля.
Глава 2: Представление экономических примитивов
Сила Anthropic Economic Index заключается в том, что он показывает не только сколько ИИ используется, но и как он используется. В предыдущих отчётах мы показали, для каких задач используется Claude и как люди сотрудничают с Claude. Эти данные позволили внешним исследователям анализировать сдвиги на рынке труда (например, Brynjolfsson, Chandar & Chen, 2025).
В этом выпуске Anthropic Economic Index мы расширяем объём данных, доступных внешним исследователям, предоставляя аналитику по пяти экономическим «примитивам» — под которыми мы подразумеваем простые, базовые показатели способов использования Claude, генерируемые путём того, что мы просим Claude ответить на конкретные вопросы об анонимизированных записях в нашей выборке. Некоторые наши примитивы охватывают несколько таких вопросов, другие используют один показатель.
Поскольку возможности ИИ развиваются столь стремительно, а экономические эффекты будут неравномерными, нам необходим широкий набор сигналов, чтобы выявить не только то, как используется Claude, но и какое воздействие окажет эта технология.
Измерения использования ИИ, важные для экономического воздействия
В этом отчёте представлены пять новых экономических примитивов помимо того, который мы уже измеряем, — паттернов сотрудничества (автоматизируют или аугментируют пользователи свои задачи с помощью Claude). Эти примитивы охватывают пять измерений диалога «человек — ИИ»: 1) сложность задачи, 2) навыки человека и ИИ, 3) рабочий, учебный или личный сценарий использования, 4) уровень автономии ИИ и 5) успешность задачи (см. Таблицу 2.1). Автономия ИИ фиксирует нечто отличное от нашего существующего разделения на автоматизацию/аугментацию. Например, «Переведи этот абзац на французский» — это высокая автоматизация (директивный режим, минимальный обмен сообщениями), но низкая автономия ИИ (задача требует от Claude минимума принятия решений).

Сложность задачи отражает то, что задачи могут различаться по сложности, включая время выполнения и трудность. Задача «отладка» в O*NET может означать как исправление Claude небольшой ошибки в функции, так и комплексный рефакторинг кодовой базы — с совершенно разными последствиями для спроса на труд. Мы измеряем сложность через оценочное время выполнения задачи человеком без ИИ, время выполнения с ИИ и то, решает ли пользователь несколько задач в рамках одного диалога.
Навыки человека и ИИ описывают, как автоматизация взаимодействует с уровнем квалификации. Если ИИ непропорционально замещает задачи, требующие меньшей экспертизы, при этом дополняя более квалифицированную работу, это может стать ещё одной формой технологического сдвига в пользу квалифицированного труда — увеличивая спрос на высококвалифицированных работников при вытеснении менее квалифицированных. Мы измеряем, мог ли пользователь выполнить задачу без Claude, и число лет образования, необходимых для понимания как запросов пользователя, так и ответов Claude.
Сценарий использования разграничивает профессиональное, образовательное и личное использование. Последствия для рынка труда наиболее непосредственно вытекают из рабочего использования, тогда как образовательное использование может сигнализировать о том, где будущая рабочая сила формирует навыки, дополняющие ИИ.
Автономия ИИ измеряет степень, в которой пользователи делегируют принятие решений Claude. Наш последний отчёт зафиксировал рост «директивного» использования, при котором пользователи полностью делегируют задачи. Отслеживание уровней автономии — от активного сотрудничества до полного делегирования — помогает прогнозировать темпы автоматизации.
Успешность задачи измеряет оценку Claude того, успешно ли Claude выполняет задачи. Успешность задачи помогает оценить, могут ли задачи быть эффективно автоматизированы (можно ли вообще автоматизировать задачу?) и экономично (сколько попыток потребуется для автоматизации задачи?). Таким образом, успешность задачи важна как для осуществимости, так и для стоимости автоматизации трудовых задач.
Отбор и валидация новых метрик
Новые измерения использования ИИ, зафиксированные в наших данных, были сформированы нашей недавней работой по оценке влияния Claude на производительность, обратной связью от внешних исследователей, современной литературой об экономическом воздействии ИИ через призму человеческого капитала и экспертизы (Vendraminell et al., 2025), а также обсуждениями в нашей команде экономических исследований. Наши основные критерии отбора — ожидаемая экономическая значимость, комплементарность измерений и способность Claude классифицировать диалоги по данному измерению с направленной точностью.
Мы полагаем, что множество простых примитивов, даже если они по отдельности несколько зашумлены и не идеально точны, вместе могут предоставить важные сигналы о том, как используется ИИ. Поэтому мы в основном тестировали направленную точность.
Для классификации длительности задач с ИИ и без мы использовали минимально модифицированные версии нашей предыдущей работы по производительности. Для новых классификаторов1, реализованных с помощью нашего инструментария с сохранением конфиденциальности, процесс валидации был следующим. Мы разработали несколько потенциальных метрик для фиксации таких концепций, как сложность задачи. Для Claude.ai мы оценивали производительность классификатора по сравнению с оценкой исследователя-человека на небольшом наборе записей, в которых пользователи давали обратную связь Claude.ai и для которых у нас, таким образом, есть разрешение на просмотр исходных записей. Для данных собственного API (1P API) мы валидируем классификаторы, используя сочетание внутренних и синтетических данных. Ни один из источников данных не является полностью репрезентативным для трафика Claude.ai или 1P API, но они позволяют нам убедиться, что классификаторы работают на данных, похожих на реальные данные использования, обеспечивая при этом конфиденциальность.
На основе первоначальной производительности мы пересмотрели классификаторы, требовавшие доработки, или отбросили те, которые показали плохие результаты. Интересно, что в некоторых случаях (например, для измерения успешности задачи) простой классификатор работал лучше, чем сложный и нюансированный, при сравнении с оценками людей. Затем мы сравнили производительность версий классификаторов с цепочкой рассуждений и без неё и решили сохранить цепочку рассуждений только для трёх аспектов (оценка времени человека, оценка времени человека с ИИ и автономия ИИ), где она существенно улучшила производительность. Мы выбрали окончательный набор из девяти новых классификаторов для пяти примитивов, все из которых направленно точны, даже если несколько отклоняются от оценок людей.
Ценность примитивов — в их предсказательной способности
Нашей целью было создание классификаторов, которые просты в реализации и в совокупности предоставляют потенциально важные экономические сигналы. Хотя мы полностью уверены в направленной точности новых метрик (например, задачи с более высоким средним числом лет образования, необходимых для понимания запроса, вероятно, более сложные), ни одну из метрик не следует воспринимать как точную или окончательную (например, Claude.ai может несколько занижать число лет образования, необходимых для многих задач).
Тем не менее примитивы обогащают наше понимание того, как люди используют ИИ. Между примитивами, регионами и задачами возникают систематические зависимости — паттерны, которые мы подробно рассматриваем в главах 3 и 4. То, что эти зависимости интуитивны и согласованы, свидетельствует о том, что примитивы улавливают релевантные аспекты того, как люди и компании используют Claude.
Внешние бенчмарки это подтверждают. В нашей работе по производительности оценки времени, сделанные Claude, коррелируют с фактическим временем, затраченным на задачи программной инженерии. Рисунок 2.1 показывает, что наша метрика образования человека коррелирует с фактическими уровнями образования работников по профессиям. Эти валидации свидетельствуют о том, что отдельные примитивы направленно верны — а их комбинирование может обеспечить дополнительную аналитическую ценность, например, обогащение оценок производительности показателями успешности задач или построение новых метрик профессиональной подверженности.

В конечном счёте наиболее убедительной валидацией станет способность примитивов улавливать значимую вариацию в исходах на рынке труда. Публикуемые нами данные позволяют внешним исследователям анализировать экономические сдвиги новыми способами. Ранние работы обнадёживают — разделение на автоматизацию/аугментацию из предыдущих отчётов уже использовалось внешними исследователями для анализа сдвигов на рынке труда (Brynjolfsson, Chandar & Chen, 2025).
Примитивы показывают различия сценариев использования
Чтобы проиллюстрировать, как примитивы различают разные типы использования ИИ, мы рассмотрим два контрастных кластера запросов: разработку программного обеспечения («Помощь в отладке, разработке и оптимизации ПО в различных областях программирования») и управление личной жизнью («Помощь в управлении личной жизнью и повседневными задачами»). Рисунок 2.2 показывает профиль примитивов для каждого кластера наряду с глобальными средними.

Сложность задачи. Claude оценивает, что запросы по разработке ПО заняли бы у компетентного специалиста примерно 3,3 часа без ИИ — близко к глобальному среднему в 3,1 часа. Задачи управления личной жизнью оцениваются как более простые — в среднем 1,8 часа. Оценочное время совместной работы человека и ИИ сопоставимо для обоих кластеров (~15 минут), показывая, что этот примитив варьируется меньше других примитивов для этих двух задач.
Навыки человека и ИИ. Запросы по разработке ПО требуют более специализированных знаний: для понимания как запросов человека, так и ответов ИИ требуется приблизительно 13,8 лет образования — по сравнению с 9,1–9,4 годами для запросов по управлению личной жизнью. Claude оценивает, что пользователи смогли бы выполнить запросы по управлению личной жизнью самостоятельно в 96% случаев против 82% для разработки ПО — что указывает на более существенную поддержку Claude в технической работе.
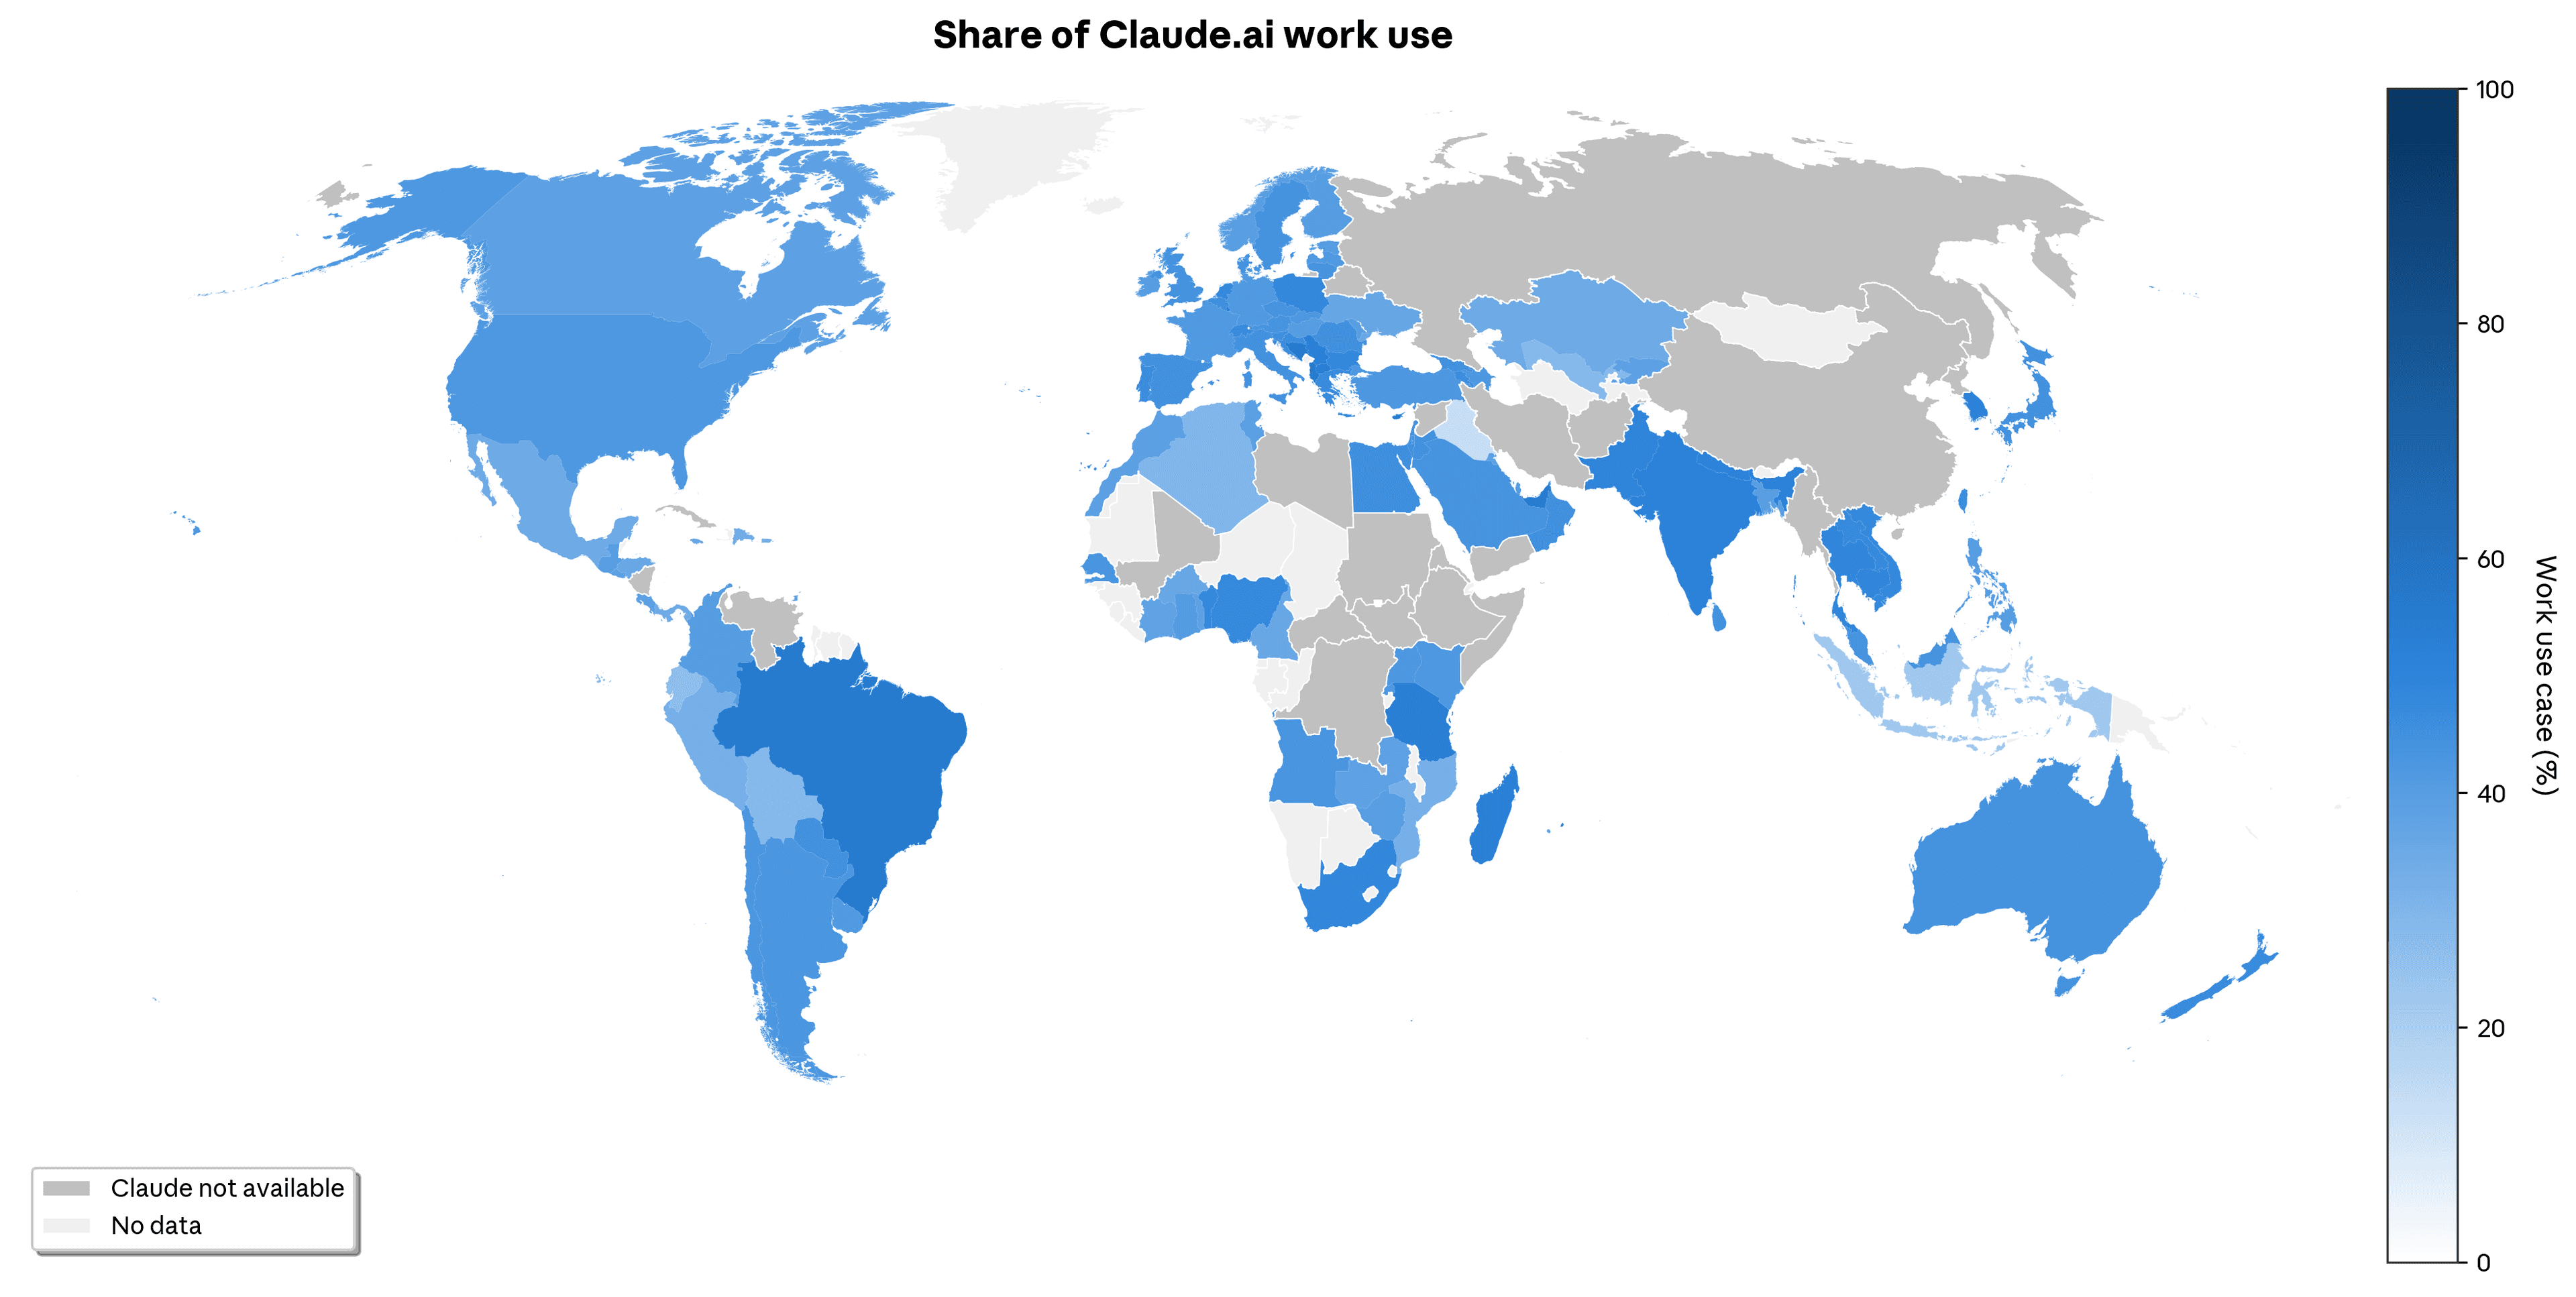
Сценарий использования. Claude классифицирует 64% запросов по разработке ПО как связанные с работой против всего 17% для управления личной жизнью. Это иллюстрирует, что Claude может использоваться для совершенно разных целей. В целом использование Claude.ai распределяется так: 46% — работа, 19% — учёба, 35% — личное.
Автономия ИИ. Оба кластера демонстрируют схожие оценочные уровни автономии (~3,5 по шкале от 1 до 5), близкие к глобальному среднему. Это означает, что и задачи разработки ПО, и задачи управления личной жизнью в среднем предоставляют Claude аналогичную автономию в принятии решений о том, как выполнять задачу.
Успешность задачи. Claude оценивает личные задачи как успешно выполненные в 78% случаев против 61% для разработки ПО. Более сложные задачи — те, которые требуют более специализированных знаний и которые пользователи не могли бы легко выполнить самостоятельно — демонстрируют более низкий оценочный процент успешности.
Задачи и примитивы различаются между пользователями Claude.ai и API
Как и в нашем предыдущем отчёте, мы обнаруживаем значительные различия в задачах и примитивах между диалогами Claude.ai и данными 1P API. Отчасти это отражает характер взаимодействия: записи Claude.ai могут включать многоходовые диалоги, тогда как анализируемые нами данные API ограничены отдельными парами «ввод-вывод». Это связано с тем, что запросы API приходят независимо, без метаданных, связывающих их с предыдущими обменами. Это означает, что мы можем анализировать их только как изолированные пары «пользователь-ассистент», а не как полные траектории диалогов.
В целом использование API в подавляющем большинстве связано с работой (74% против 46%) и является директивным (64% против 32%), при этом три четверти взаимодействий классифицируются как автоматизация — по сравнению с менее чем половиной на Claude.ai (см. Рисунок 1.3).
Пользователи Claude.ai, напротив, ведут более активный обмен: режимы итерации задач и обучения значительно более распространены, а задачи, как правило, более длительны — как по времени работы человека с ИИ (15 минут против 5 минут), так и по оценочному времени, которое потребовалось бы человеку для самостоятельного выполнения задачи (3,1 часа против 1,7 часа). Claude.ai также демонстрирует более высокие показатели успешности задач (67% против 49%), что может отражать преимущества многоходового диалога, при котором пользователи могут уточнять, корректировать курс и итеративно приходить к решению. Пользователи Claude.ai также предоставляют ИИ больше автономии в среднем и чаще приносят задачи, которые не могли бы выполнить самостоятельно.
Эти различия также отражаются в профессиональном распределении задач. Использование API сильно сконцентрировано на задачах в области компьютерных и математических наук (52% против 36%), что согласуется с его применением для программных, удобных для автоматизации процессов — таких как генерация кода и обработка данных. Задачи офисной и административной поддержки также более распространены в API (15% против 8%), отражая рутинные бизнес-операции, подходящие для делегирования. Claude.ai, напротив, демонстрирует значительно больше задач из категории «Образовательное обучение» (16% против 4%) — помощь с учёбой, репетиторство и разработка учебных материалов — а также больше задач в области искусства, дизайна и развлечений (11% против 6%). Claude.ai также имеет более длинный хвост человекоориентированных категорий, таких как общественные и социальные услуги и медицинские работники, где пользователи ищут советы, консультации или информацию по личным вопросам.
Эти паттерны свидетельствуют о том, что развёртывания через 1P API концентрируются на задачах, поддающихся систематической автоматизации, тогда как Claude.ai обслуживает более широкий спектр сценариев использования — включая обучение, творческую работу и личную помощь.
В главе 4 подробнее рассматривается вариация на уровне задач.
1 Классификатор — это модель, которая присваивает данному вводу (например, диалогу пользователя) конкретный вывод (например, сценарий использования «работа»). В этом отчёте мы используем Claude в качестве классификатора, то есть просим Claude выбрать конкретный вывод, а затем используем ответ Claude как результат (см. Таблицу 2.1 для промптов).
2 В этом отчёте мы используем группированные диаграммы рассеяния для отображения двумерных зависимостей. Мы делим наблюдения на 20 равных групп на основе переменной x, а затем отображаем средние значения x и y для каждой группы. Крайняя левая точка, например, представляет средние значения для наблюдений в нижних 5% распределения x.
Глава 3: Как использование Claude варьируется по географии
Обзор
В этой главе мы анализируем географическую вариацию паттернов использования Claude с помощью анализа с сохранением конфиденциальности¹ 1 миллиона диалогов Claude.ai². Мы делаем пять наблюдений:
Claude в основном используется для работы, но сценарии использования диверсифицируются с ростом внедрения: Рабочие и личные сценарии более распространены в странах с более высоким доходом, тогда как учебные сценарии более распространены в странах с более низким доходом. Это перекликается с выводами нашего предыдущего отчёта и согласуется с недавней работой Microsoft.ВВП и образование предсказывают внедрение глобально и внутри США: Увеличение ВВП на душу населения на 1% ассоциируется с увеличением использования Claude на душу населения на 0,7% на уровне стран. Образование человека — оценка Claude числа лет формального образования, необходимых для понимания запроса, — положительно коррелирует с индексом Anthropic AI Usage Index на обоих уровнях.Другие примитивы предсказывают внедрение по-разному на глобальном уровне и уровне штатов США: На уровне стран более высокое использование коррелирует с более короткими задачами и меньшей автономией ИИ. На уровне штатов США эти зависимости статистически не значимы, хотя использование для работы положительно коррелирует с внедрением.Связи между примитивами зависят от контекста: Успешность задач негативно связана с образованием на уровне стран, но положительно — на уровне штатов США. Однако при контроле других примитивов зависимость на уровне США становится незначимой.Как люди формулируют запросы — так Claude отвечает: Уровни образования запросов и ответов ИИ почти идеально коррелируют (r > 0,92 на обоих уровнях). Страны с более высоким использованием на душу населения также демонстрируют больше аугментации — используя Claude как соратника, а не полностью делегируя решения.
Claude в основном используется для работы, но сценарии использования диверсифицируются с ростом внедрения
Наши данные, основанные на анализе с сохранением конфиденциальности1 1 миллиона диалогов Claude.ai2, выявляют поразительные географические различия в том, как внедряется Claude. Claude преимущественно используется для работы — по всему миру и по территории Соединённых Штатов. Однако существует географическая вариация сценариев использования. На глобальном уровне Балканы и Бразилия имеют наибольшую относительную долю рабочего использования (см. Рисунок 3.1), а Индонезия выделяется самой высокой долей учебного использования. На уровне штатов США Нью-Йорк выделяется как штат, использующий Claude относительно чаще всего для работы.
Различия в сценариях использования связаны с подушевым доходом страны, который, в свою очередь, связан с подушевым внедрением ИИ. Мы наблюдаем, что рабочие и личные сценарии использования Claude более распространены в странах с более высоким доходом, тогда как учебные сценарии более распространены в странах с более низким доходом (см. Рисунок 3.2). Интересно, что эти результаты сходятся с недавней работой Microsoft, показывающей, что использование ИИ для учёбы ассоциируется с более низким подушевым доходом, тогда как использование ИИ для досуга ассоциируется с более высоким подушевым доходом.

Множество факторов может способствовать этим паттернам:
Личные сценарии использования могут стать более распространёнными по мере роста внедрения ИИ и привлечения более разнообразных пользователей, или когда существующие пользователи исследуют более широкий спектр применений ИИ. Напротив, страны с более низким подушевым внедрением (которое коррелирует с более низким подушевым доходом) могут быть сосредоточены на конкретных сценариях использования — таких как программирование или учёба. Страны различаются по способности платить за Claude, и учебные сценарии могут лучше подходить для бесплатного использования Claude, чем сложные сценарии в рабочих областях — таких как программная инженерия. Пользователи в странах с более высоким доходом могут иметь другие ресурсы — такие как свободное время и постоянный доступ в интернет — которые позволяют использовать Claude для несущественных личных целей.
Международное и внутриамериканское внедрение различаются по экономическим примитивам
Экономические примитивы, представленные в этом отчёте, позволяют нам анализировать некоторые факторы, которые могут определять различия во внедрении. При анализе зависимости между индексом Anthropic AI Usage Index (AUI) и основными экономическими примитивами, а также ВВП, мы наблюдаем, что определённые паттерны действуют как для стран, так и для штатов США. Например, мы воспроизводим вывод из нашего предыдущего отчёта о том, что ВВП сильно коррелирует с AUI (см. Рисунки 3.3 и 3.4). На уровне стран увеличение ВВП на душу населения на 1% ассоциируется с увеличением использования Claude на душу населения на 0,7%. Образование человека (сколько лет образования требуется для понимания написанных человеком запросов в диалоге) положительно и значимо коррелирует с индексом Anthropic AI Usage Index как на уровне стран, так и на уровне штатов США.


Однако зависимость между AUI и примитивами часто различается на уровне стран и штатов США. Например, на уровне стран AUI негативно коррелирует со временем, которое потребовалось бы человеку для выполнения задачи без ИИ, и с тем, сколько автономии в принятии решений предоставляется ИИ. На уровне штатов США эти зависимости статистически не значимы — вероятно, также из-за меньшего размера выборки для штатов. Кроме того, мы наблюдаем положительную корреляцию между AUI и использованием Claude.ai для работы на уровне штатов, но не на уровне стран.
Важно отметить, что примитивы сами по себе не обязательно являются причинными факторами — мы не знаем, действительно ли доход или образование определяют внедрение, или они являются прокси для других базовых условий. Многие из этих факторов сильно коррелируют друг с другом. Например, на уровне штатов США годы образования демонстрируют сильную связь с индексом Anthropic AI Usage Index по отдельности, но эта зависимость исчезает при контроле ВВП и других примитивов — что свидетельствует о том, что образование может отражать вариацию, лучше объясняемую экономическим развитием и другими факторами.
Институциональные факторы формируют связь между успешностью задач и годами образования
Экономический и институциональный контекст — например, как различаются уровни образования внутри географии — связан с тем, как используется ИИ. Интересно, что мы наблюдаем негативную связь между успешностью задач и образованием на уровне стран, но положительную — на уровне штатов США. Однако положительная зависимость на уровне штатов становится незначимой при контроле других примитивов (см. Рисунок 3.5). Это означает, что паттерн зависимости на одном уровне наблюдения (страна) противоречит паттерну на другом уровне (штат США). На межстрановом уровне образованные популяции могут пытаться решать более сложные задачи и поэтому получать более низкие показатели успешности. В однородных контекстах образование может не улучшать успешность задач.

Как люди формулируют запросы — так Claude отвечает
Мы обнаруживаем очень высокую корреляцию между образованием человека и ИИ, то есть числом лет образования, необходимых для понимания запроса человека или ответа ИИ (страны: r = 0,925, p < 0,001, N = 117; штаты США: r = 0,928, p < 0,001, N = 50). Это подчёркивает важность навыков и свидетельствует о том, что от качества запроса зависит эффективность ответа ИИ. Это также подчёркивает важность проектирования и обучения моделей. Хотя Claude способен отвечать на очень высоком уровне, он склонен делать это лишь тогда, когда пользователи вводят сложные запросы.
То, как модели обучаются, дообучаются и инструктируются, влияет на то, как они отвечают пользователям. Например, одна модель ИИ может иметь системный промпт, инструктирующий её всегда использовать простой язык, понятный ученику средней школы, тогда как другая модель может отвечать только на сложном языке, требующем докторской степени для понимания. Для Claude мы наблюдаем более динамичный паттерн, при котором то, как пользователь формулирует запрос, определяет то, как Claude отвечает.
Более высокий доход и более интенсивное использование связаны с большей аугментацией
Страны с более высоким подушевым использованием, которые, как правило, являются странами с более высоким подушевым доходом, демонстрируют меньшую автоматизацию и меньшую автономию принятия решений, делегируемую Claude. То есть страны с более высоким доходом используют ИИ больше как помощника и соратника, а не позволяют ему работать самостоятельно. Эта зависимость не значима на уровне штатов США — возможно, потому что вариация доходов и разнообразие сценариев использования внутри Соединённых Штатов более ограничены, чем в глобальном масштабе. Это перекликается с выводом нашего 3-го отчёта Economic Index о том, что страны с более высоким индексом Anthropic AI Usage Index склонны использовать Claude в более коллаборативном ключе (аугментация), а не позволять ему работать самостоятельно (автоматизация).
Заключение
Поразительная географическая вариация в наших данных показывает, что Claude используется по-разному в разных частях мира. ВВП предсказывает индекс Anthropic AI Usage Index как на уровне стран, так и на уровне штатов США, а образование — сложность запросов пользователей — коррелирует с внедрением на обоих уровнях.
Другие зависимости определяются контекстом. На уровне стран более высокое использование коррелирует с более короткими задачами и меньшей автономией ИИ; внутри США эти паттерны не наблюдаются. Успешность задач и образование демонстрируют противоположные зависимости на глобальном уровне и внутри США.
Практически идеальная корреляция между годами образования человека и ИИ подчёркивает, что то, как пользователи формулируют запросы Claude, определяет то, как он отвечает. В сочетании с выводом о том, что страны с более интенсивным использованием взаимодействуют с Claude более коллаборативно, это свидетельствует о том, что навыки, необходимые для эффективного использования ИИ, сами по себе могут быть неравномерно распределены.
Измеряя характеристики диалогов с Claude, мы обнаруживаем важные зависимости с более широкими экономическими факторами — такими как человеческий капитал. Эти зависимости могут помочь прогнозировать исходы на рынке труда и обеспечить плавный переход к экономике с поддержкой ИИ, которая потребует иных наборов навыков.
1 По соображениям конфиденциальности наша автоматизированная система анализа отфильтровывает ячейки — например, страны и пересечения (страна, задача) — с менее чем 15 диалогами и 5 уникальными учётными записями пользователей. Для кластеров запросов, построенных снизу вверх, мы используем ещё более высокий фильтр конфиденциальности — не менее 500 диалогов и 250 уникальных учётных записей.
2 Данные в этом разделе охватывают 1 миллион диалогов Claude.ai уровней Free, Pro и Max с 13 по 20 ноября 2025 года, случайно отобранных из всех диалогов за этот период. Затем мы исключили контент, помеченный как потенциальные нарушения правил доверия и безопасности. Единицей наблюдения является диалог с Claude на Claude.ai, а не пользователь, поэтому возможно включение нескольких диалогов одного пользователя, хотя наша предыдущая работа свидетельствует о том, что случайная выборка диалогов и стратифицированная по пользователям выборка не дают существенно различных результатов. Агрегированная географическая статистика на уровне стран и штатов США была оценена и табулирована по IP-адресу каждого диалога. Для геолокации мы используем коды ISO-3166, поскольку наш провайдер IP-геолокации использует этот стандарт. Международные местоположения используют коды стран ISO-3166-1, данные на уровне штатов используют коды регионов ISO-3166-2, которые включают все 50 штатов США и Вашингтон, округ Колумбия. Мы исключаем диалоги, исходящие от VPN, anycast или хостинг-сервисов, как определено нашим провайдером IP-геолокации.
3 Карта мира основана на карте мира Natural Earth с точкой зрения стандарта ISO для спорных территорий, что означает, что карта может не содержать некоторых спорных территорий. Мы отмечаем, что помимо стран, показанных серым цветом («Claude недоступен»), мы не работаем в украинских регионах Крым, Донецк, Херсон, Луганск и Запорожье. В соответствии с международными санкциями и нашей приверженностью поддержке территориальной целостности Украины наши услуги недоступны на территориях, находящихся под российской оккупацией.
4 «Нет данных» относится к странам с частично отсутствующими данными. Некоторые территории (например, Западная Сахара, Французская Гвиана) имеют собственный код ISO-3611. Некоторые из них имеют определённое использование, другие — нет. Поскольку индекс Anthropic AI Usage Index рассчитывается на душу трудоспособного населения на основе данных Всемирного банка о населении трудоспособного возраста, а данные о населении доступны не для всех этих территорий, мы не можем рассчитать AUI для них.
5 Мы исключаем Сейшельские Острова из всех географических анализов, поскольку значительная часть использования, зафиксированного в дни выборки, представляла собой злонамеренный трафик.
6 Мы исключаем Вайоминг из всех анализов на уровне штатов США, поскольку значительная часть использования, зафиксированного в дни выборки, представляла собой злонамеренный трафик.
Глава 4: Задачи и производительность
В этой главе мы рассматриваем, как экономия времени, показатели успешности и автономия варьируются по типам задач и что это означает для потенциального воздействия на рабочие места и производительность.
Выявленные паттерны показывают, что более сложные задачи дают большую экономию времени, но это компенсируется снижением надёжности. В упражнении по удалению задач, вдохновлённом работой Autor and Thompson (2025), склонность Claude покрывать задачи с более высокими образовательными требованиями приводит к чистому эффекту деквалификации в большинстве профессий, поскольку задачи, которые берёт на себя ИИ, часто являются более квалифицированными компонентами работы.
Использование Claude охватывает значительную долю задач во всё большем числе профессий. Мы включаем показатели успешности в более детальную модель охвата профессий; некоторые профессии со скромным охватом испытывают значительное воздействие, поскольку ИИ успешно справляется с их наиболее трудоёмкими задачами. Корректировка оценок производительности с учётом надёжности задач примерно вдвое снижает подразумеваемый рост — с 1,8 до примерно 1,0 процентного пункта ежегодного роста производительности труда в следующем десятилетии. Однако эти оценки отражают текущие возможности моделей, и все признаки указывают на то, что надёжность при выполнении всё более длительных задач будет расти.
Компромиссы в ускорении задач
Наши оценки свидетельствуют о том, что в целом более сложные задачи в наших данных дают большую экономию времени (или «ускорение») благодаря ИИ. Мы получаем этот показатель, поручая Claude оценить как время, которое потребовалось бы человеку, работающему самостоятельно, так и продолжительность при совместной работе человека и ИИ — что мы валидировали в предыдущей работе. Ускорение — это время работы человека в одиночку, делённое на время работы человека с ИИ. Таким образом, сокращение часовой задачи до 10 минут даёт 6-кратное ускорение.
Левая панель Рисунка 4.1 ниже показывает среднее ускорение в зависимости от нашей ключевой метрики сложности задачи — числа лет обучения, необходимых для понимания вводных данных — всё на уровне задач O*NET1. Она показывает, что в диалогах Claude.ai, например, запросы, требующие 12 лет обучения (среднее образование), получают ускорение в 9 раз, тогда как запросы, требующие 16 лет обучения (высшее образование), достигают 12-кратного ускорения. Это подразумевает, что прирост производительности более выражен для сценариев, требующих более высокого человеческого капитала, что согласуется с данными о том, что «белые воротнички» значительно чаще внедряют ИИ (например, Bick et al 2025).
Во всём диапазоне сложности задач ускорение выше для пользователей API. Это может отражать природу данных API, ограниченных одноходовыми взаимодействиями, а также то, что задачи API были специально отобраны для автоматизации.

Результаты также фиксируют компромисс. Более сложные задачи имеют более низкий процент успешности, как показано на правой панели. На Claude.ai, например, задачи, требующие менее чем среднего образования (например, ответы на простые вопросы о продуктах), достигают 70% успешности, но этот показатель снижается до 66% для диалогов уровня высшего образования — таких как разработка планов анализа. Тем не менее учёт разницы в показателях успешности — путём исключения задач с низкой успешностью или дисконтирования ускорений на вероятность успеха — не устраняет образовательный градиент: сложные задачи по-прежнему демонстрируют больший чистый прирост производительности.
Один из способов изучить последствия образовательного градиента — посмотреть на долю автоматизации по уровням образования, необходимым для понимания вводных данных. Если задачи с высоким уровнем образования демонстрируют относительно больше автоматизации, это может сигнализировать о большей подверженности «белых воротничков». Однако здесь послание неоднозначно: доля автоматизации практически не связана с уровнем образования, необходимым для написания запроса (Приложение, Рисунок A.1)2. Как на Claude.ai, так и в 1P API задачи всех уровней образования демонстрируют паттерны автоматизации примерно в равных пропорциях.
В каких контекстах пользователи больше полагаются на Claude? Пользователи Claude.ai предоставляют ИИ немного больше автономии при работе над более сложными задачами. Напротив, использование API демонстрирует равномерно низкую автономию на всех уровнях сложности.

Следует отметить, что эти распределения не охватывают один и тот же набор задач. Использование API покрывает более узкий спектр задач в экономике, как видно из графика концентрации в главе 1. Задачи с высоким уровнем образования, активно используемые через API, включают анализ безопасности, тестирование и контроль качества, а также обзор кода, тогда как пользователи Claude.ai чаще ведут итеративные обучающие сессии.
Горизонты задач в реальном использовании

Недавние работы о «горизонтах задач» ИИ (Kwa et al., 2025) показывают, что процент успешности ИИ снижается с увеличением длительности задачи: более длинные задачи сложнее для моделей. Однако с каждым новым поколением моделей это снижение становится более пологим, поскольку модели успешно справляются со всё более длинными задачами. METR операционализирует горизонт задач преимущественно как максимальную длительность, при которой модель достигает не менее 50% успешности, и рост этого показателя стал ключевым индикатором прогресса ИИ.
Рисунок 4.3 показывает аналогичную метрику с использованием наших примитивов. График отображает показатели успешности на уровне задач в зависимости от необходимого человеческого времени — всё на уровне задач O*NET. В данных API показатели успешности снижаются примерно с 60% для задач менее часа до примерно 45% для задач, оцениваемых в 5+ часов человеческого времени. Линия регрессии пересекает горизонтальную линию 50% успешности на отметке 3,5 часа, что свидетельствует о том, что вызовы API достигают 50% успешности для задач длительностью 3,5 часа. Аналогичная оценка времени в бенчмарке METR для программной инженерии составляет 2 часа для Sonnet 4.5 и около 5 часов для Opus 4.5. (Данные в этом отчёте предшествуют выпуску Opus 4.5.)
Данные Claude.ai рассказывают другую историю. Показатели успешности снижаются значительно медленнее в зависимости от длительности задачи. При экстраполяции с помощью линейной аппроксимации Claude.ai достиг бы 50% успешности примерно на отметке 19 часов. Это может отражать то, как многоходовой диалог фактически разбивает сложные задачи на более мелкие шаги, при этом каждый ход обеспечивает петлю обратной связи, позволяющую пользователям корректировать курс.
Стоит отметить, что фундаментальное отличие от условий METR — это отбор. METR конструирует бенчмарк, в котором фиксированный набор задач назначается моделям. В наших данных пользователи сами выбирают, какие задачи приносить Claude. Это означает, что наблюдаемые показатели успешности отражают не только возможности модели, но и суждение пользователей о том, что сработает, стоимость постановки задачи для Claude и ожидаемую экономию времени в случае успеха.
Если пользователи избегают задач, в успехе которых они сомневаются, наблюдаемые показатели успешности будут завышать реальные возможности на полном распределении потенциальных задач. Этот эффект отбора, вероятно, действует на обеих платформах, но по-разному: клиенты API отбирают задачи, поддающиеся автоматизации, тогда как пользователи Claude.ai отбирают задачи, которые могут выиграть от итерации. Также из-за этого эффекта отбора нет гарантии, что более производительные модели покажут улучшение на этом графике, поскольку пользователи могут реагировать на новые модели, предоставляя более сложные формулировки схожих задач O*NET.
Контролируемые бенчмарки, такие как у METR, измеряют границы автономных возможностей. Наши данные из реального мира измеряют эффективный горизонт задач, отражающий сочетание возможностей модели и поведения пользователей и выходящий за рамки задач программирования. Оба подхода обнаруживают, что ИИ может быть эффективен для задач, требующих часов человеческой работы.
Пересмотр проникновения в профессии с помощью эффективного охвата ИИ
Наша более ранняя работа показала, что 36% профессий имели использование ИИ как минимум для четверти своих задач, причём около 4% достигали 75% охвата задач. Однако эта метрика основывалась лишь на появлении задачи в наших данных. Примитивы, представленные в этом отчёте, помогают лучше охарактеризовать то, как ИИ меняет содержание работы профессий.3
Во-первых, мы обнаруживаем, что охват задач растёт. В совокупности по отчётам 49% профессий зафиксировали использование ИИ как минимум для четверти своих задач. Но учёт доли задачи в профессии и среднего процента успешности Claude указывает на иной набор затронутых профессий.
Мы определяем эффективный охват ИИ как процент рабочего дня работника, который может быть успешно выполнен Claude. Он рассчитывается как взвешенная сумма показателей успешности задач, где вес каждой задачи определяется её долей в рабочем времени работника с поправкой на частоту выполнения задачи. Показатель успешности берётся из наших примитивов, оценка часов — из нашей предыдущей работы о влиянии на производительность, а оценка частоты — из данных O*NET, где опрошенные работники указывают, как часто они выполняют ту или иную задачу.
График ниже показывает, как эффективный охват ИИ (ось y) отличается от простого охвата задач (ось x). Два показателя сильно коррелируют, но с ключевыми различиями. В правой части графика профессии с высоким охватом — где почти все задачи с некоторой частотой появляются в данных Claude — как правило, располагаются ниже линии 45 градусов. Это свидетельствует о том, что даже 90% охват задач не обязательно указывает на значительное воздействие на профессию, поскольку Claude может не справляться с ключевыми покрытыми задачами или пропускать наиболее трудоёмкие.

При более детальном рассмотрении несколько профессий демонстрируют большие расхождения между эффективным охватом ИИ и охватом задач. Например, операторы ввода данных имеют один из самых высоких показателей эффективного охвата ИИ. Это объясняется тем, что хотя покрыты только две из девяти их задач, крупнейшая задача — чтение и ввод данных из исходных документов — имеет высокие показатели успешности с Claude. ИИ превосходно справляется с тем, на что они тратят большую часть своего времени.
Медицинские транскрибаторы и радиологи также поднимаются в рейтинге, поскольку их покрытые задачи оказываются наиболее трудоёмкими и часто выполняемыми. Для радиологов две главные задачи — интерпретация диагностических изображений и подготовка интерпретационных отчётов — имеют высокие показатели успешности. Эти профессии имеют низкий охват задач, поскольку ИИ не может выполнять практическую или административную работу в их профессиональных профилях, но он успешно справляется с ключевой интеллектуальной работой, которая доминирует в их рабочем дне.
Микробиологи располагаются ниже линии 45 градусов, что свидетельствует о более низком эффективном охвате ИИ, чем можно было бы предсказать по охвату задач. Claude покрывает половину их задач, но не самые трудоёмкие: практические исследования с использованием специализированного лабораторного оборудования.
Эта метрика, вероятно, даёт более реалистичную картину проникновения ИИ на уровне профессий. Однако её последствия зависят от того, насколько часто эти диалоги с Claude фактически вытесняют или дополняют работу, которая иначе выполнялась бы людьми. Для операторов ввода данных ИИ, вероятно, действительно замещает задачи, ранее выполнявшиеся вручную. Но когда диалог с Claude соответствует задаче преподавателя, читающего лекцию, менее очевидно, как это переводится в сокращение лекционного времени на работе. В будущей работе мы могли бы использовать данные 1P API, чтобы понять, какие из этих задач интегрируются в производственные процессы.
Влияние ИИ на содержание задач в профессиях
Помимо вопроса о том, какую долю рабочего дня ИИ может успешно выполнять, отдельный вопрос — какие именно задачи покрываются и являются ли они высококвалифицированными или низкоквалифицированными компонентами профессии. Недавние исследования изучали изменения в структуре задач внутри профессий для понимания влияния ИИ на заработную плату и занятость (Autor and Thompson 2025; Hampole et al 2025). Ключевой вывод состоит в том, что последствия автоматизации зависят не только от количества покрытых задач, но и от того, какие именно задачи покрываются.
Чтобы увидеть, как меняются профессии при удалении задач, выполняемых ИИ, мы сначала конструируем метрику уровня квалификации, необходимого для каждой задачи. O*NET не предоставляет требований к образованию на уровне задач, поэтому мы обучаем модель, предсказывающую число лет обучения по эмбеддингам задач, используя в качестве целевой переменной уровень образования для профессии от BLS4. Таким образом, профессия с низким образовательным уровнем может иметь высококвалифицированную задачу, если она похожа на задачи, типичные для профессий с высоким уровнем образования. Например, «Юридические секретари» — это профессия с 12-летним образованием, но задача «Обзор юридических публикаций и поиск по базам данных для выявления законов и судебных решений, относящихся к рассматриваемым делам» прогнозируется на уровне 17,7 лет, поскольку она напоминает задачи, обычно выполняемые юристами и помощниками юристов.
Данные показывают, что Claude склонен покрывать задачи, требующие более высокого уровня образования. Среднее прогнозируемое образование для задач в экономике составляет 13,2 года. Для задач, которые мы наблюдаем в наших данных, среднее значение примерно на год выше — 14,4 года (что соответствует степени Associate). Это согласуется с результатами на уровне профессий из предыдущих отчётов, показывающими более интенсивное использование Claude среди «белых воротничков».

Далее мы рассчитываем, как удаление задач, покрытых ИИ, сдвигает средний уровень образования оставшихся задач. В целом чистое воздействие первого порядка — деквалификация профессий, поскольку ИИ забирает задачи, требующие относительно более высокого уровня образования. Одна из профессий, испытывающих такую деквалификацию, — технические писатели, которые теряют задачи вроде «Анализ разработок в конкретной области для определения необходимости пересмотра» (18,7 лет) и «Обзор опубликованных материалов и рекомендации по изменениям в объёме, формате» (16,4 года), оставляя задачи вроде «Создание эскизов для иллюстрации определённых материалов» (13,6 лет) и «Наблюдение за производственной, разработочной и экспериментальной деятельностью» (13,5 лет). Турагенты также испытывают деквалификацию, поскольку ИИ покрывает задачи вроде «Планирование, описание, организация и продажа туристических пакетов» (13,5 лет) и «Расчёт стоимости проезда и проживания» (13,4 года), тогда как задачи вроде «Печать или заказ транспортных билетов» (12,0 лет) и «Сбор оплаты за транспорт и проживание» (11,5 лет) остаются. Несколько педагогических профессий испытывают деквалификацию, поскольку ИИ решает задачи — такие как выставление оценок, консультирование студентов, написание грантов и проведение исследований — не имея возможности выполнять практическую работу по чтению лекций и управлению аудиторией.
Некоторые профессии демонстрируют рост среднего уровня образования. Управляющие недвижимостью испытывают повышение квалификации, поскольку ИИ покрывает рутинные административные задачи — ведение записей о продажах (12,8 лет), сравнение арендных ставок с рыночными (12,6 лет) — тогда как задачи, требующие более высокого профессионального суждения и личного присутствия, остаются — например, оформление кредитов, переговоры с архитектурными фирмами и встречи с советами директоров.
Эти паттерны иллюстрируют, как профессии могут эволюционировать в ближайшие годы по мере того, как их содержание задач корректируется в ответ на ИИ. Если уровень образования можно интерпретировать как экспертизу в анализе Autor and Thompson, их фреймворк мог бы предсказать, что заработная плата снизится, а занятость возрастёт для технических писателей и турагентов; напротив, управляющие недвижимостью будут специализироваться на сложных переговорах и управлении заинтересованными сторонами, сокращая занятость при росте заработной платы.5
Однако наша метрика на основе образования отличается от концепции экспертизы Autor and Thompson: их фреймворк маркировал бы некоторые задачи как высокоэкспертные там, где наша метрика указывает на низкий уровень образования — например, задача электрика «Подключение проводов к автоматическим выключателям, трансформаторам или другим компонентам». И эти прогнозы основаны на текущих паттернах использования Claude, которые будут меняться по мере обучения моделей новым возможностям и обнаружения пользователями новых применений — потенциально меняя, какие задачи покрываются и является ли чистый эффект деквалификацией или повышением квалификации.
Пересмотр совокупных последствий использования Claude для производительности
В более ранней работе мы оценили, что широкое внедрение ИИ может увеличить рост производительности труда в США на 1,8 процентного пункта в год в течение следующего десятилетия. Здесь мы пересматриваем этот анализ, включая примитив успешности задач, представленный в этом отчёте, и более детальный учёт комплементарности задач.
На основе ускорений, связанных с задачами, имеющими не менее 200 наблюдений в нашей выборке из 1 млн диалогов Claude.ai,6 мы воспроизводим наш предыдущий вывод о том, что модели ИИ текущего поколения и текущие паттерны использования подразумевают эффект производительности в 1,8 процентного пункта в год в течение следующего десятилетия.7
С включением данных 1P API мы можем оценить, различаются ли подразумеваемые эффекты на производительность труда в зависимости от корпоративных паттернов развёртывания Claude. Действуют две противоположные силы: использование API более сконцентрировано в более узком наборе задач и профессий (особенно связанных с программированием), что снижало бы подразумеваемые эффекты; но ускорения на уровне задач в среднем выше среди задач API, как следует из Рисунка 4.1. Эти силы в значительной мере компенсируют друг друга: выборка API также подразумевает рост производительности труда на 1,8 процентного пункта в течение следующего десятилетия.
Существенная критика этого анализа состоит в том, что он не учитывает надёжность модели. Если работники должны проверять результаты ИИ, выигрыш в производительности будет меньше, чем предполагают «сырые» ускорения. Чтобы оценить количественную значимость этого канала, мы включаем примитив успешности задач, представленный в этом отчёте, умножая экономию времени на уровне задач на процент успешности конкретных задач перед агрегированием.8
Эта корректировка оказывает существенный эффект: подразумеваемый рост производительности снижается с 1,8 до 1,2 процентного пункта в год на следующее десятилетие на основе использования Claude.ai и до 1,0 процентного пункта для API-трафика. Тем не менее даже с учётом надёжности подразумеваемое воздействие остаётся экономически значимым — устойчивый рост на 1,0 процентный пункт в год в течение следующих десяти лет вернул бы рост производительности в США к показателям конца 1990-х — начала 2000-х годов. Вторая критика касается комплементарности задач. Если некоторые задачи являются незаменимыми и не могут быть легко замещены, то общие эффекты на производительность будут ограничены вне зависимости от ускорений по другим задачам. Преподаватели могут более эффективно готовить планы уроков с помощью ИИ, не влияя при этом на время, проводимое со студентами в аудитории.
Для операционализации этой идеи мы вводим некоторую структуру в агрегирование экономии времени на уровне задач внутри профессий, но в остальном суммируем приросты эффективности по профессиям как в основном анализе. В частности, мы предполагаем, что внутри каждой профессии задачи комбинируются по агрегатору с постоянной эластичностью замещения (CES), где каждая задача взвешена по оценочному времени, затрачиваемому на задачу, как рассчитано в нашем более раннем анализе эффектов производительности, подразумеваемых использованием Claude.9
Ключевой параметр — эластичность замещения между задачами, σ. Когда эластичность замещения меньше единицы, задачи являются комплементами, и те задачи, которые не ускоряются ИИ, становятся узкими местами для общего прироста производительности. Наоборот, когда эластичность замещения больше единицы, работники могут перераспределяться на более продуктивные задачи — тем самым усиливая общую экономию времени на уровне профессии. Эластичность замещения, равная единице, — это частный случай, воспроизводящий основной анализ выше.
Рисунок 4.6 представляет результаты этого упражнения для различных значений взаимозаменяемости задач. Как и ожидалось, при эластичности замещения, равной единице, подразумеваемый эффект на производительность совпадает с нашим базовым анализом: рост производительности труда на ~1,8 процентного пункта в год в течение следующего десятилетия, подразумеваемый обеими выборками — Claude.ai и API.

Однако когда задачи являются комплементами, подразумеваемое совокупное воздействие на производительность труда резко снижается, поскольку экономические эффекты ограничиваются узкими местами — задачами, которые ИИ ускоряет в наименьшей степени. Например, при σ = 0,5 подразумеваемый эффект на общую производительность труда составляет 0,7–0,9 процентного пункта в год — примерно вдвое меньше базовых оценок. Дополнительная корректировка на успешность задач ещё более снижает подразумеваемые эффекты до 0,8 п.п. для Claude.ai и 0,6 п.п. для API.
С другой стороны, когда эластичность замещения больше единицы, подразумеваемая производительность труда на основе паттернов использования до выхода Opus 4.5 существенно выше. Например, при σ = 1,5 подразумеваемый эффект на производительность труда возрастает до 2,2–2,6 процентного пункта в год, что согласуется с более глубокой специализацией на задачах, где ИИ обеспечивает наибольшее ускорение.
В обоих случаях подразумеваемое воздействие на производительность на основе API-трафика более чувствительно к степени взаимозаменяемости задач. Это согласуется с тем, что большая доля API-трафика сконцентрирована в меньшем числе задач и связанных профессий по сравнению с Claude.ai: когда задачи являются комплементами, эта концентрация усиливает проблему узких мест; когда они являются субститутами, она усиливает прирост производительности от специализации на задачах.
Этот анализ показывает, что эффекты автоматизации на производительность в конечном счёте могут быть ограничены задачами-узкими местами, которые пока не поддаются автоматизации ИИ. А последствия для рынка труда от всё более способного ИИ могут аналогично подвергаться влиянию таких сил. Например, Gans and Goldfarb (2026) утверждают, что наличие задач-узких мест внутри профессий означает, что частичная автоматизация ИИ может привести к росту трудовых доходов, поскольку такие задачи возрастают в экономической ценности (по крайней мере, до полной автоматизации профессии).
Заключение
Главный вывод этой главы состоит в том, что влияние ИИ на экономику вряд ли будет равномерным. Как показывает наш фреймворк эффективного охвата ИИ, последствия для рынка труда для разных работников будут зависеть от того, насколько надёжны передовые инструменты ИИ для их наиболее центральных задач.
Но последствия для рынка труда могут также зависеть от требований к квалификации задач, с которыми ИИ компетентно справляется, по сравнению с остальной экономикой. Действительно, мы обнаруживаем, что удаление задач, которые Claude уже может выполнять, из экономики привело бы к чистому эффекту деквалификации: задачи, остающиеся для людей, имеют более низкие образовательные требования, чем те, которые выполняет ИИ.
Хотя это весьма показательно, возможно, упускается важная деталь: наиболее сложные задачи, для которых используется Claude, как правило, являются теми, с которыми он справляется хуже всего. Вместо вытеснения высококвалифицированных специалистов это может, напротив, укрепить ценность их комплементарной экспертизы в понимании работы ИИ и оценке её качества.
Обратной стороной этих трансформационных последствий для рынка труда является более широкое влияние на рост и производительность. С одной стороны, включение надёжности задач в наш анализ снижает подразумеваемый эффект на рост производительности труда, основанный на текущих паттернах использования Claude. Если задачи-узкие места ограничивают процесс, подразумеваемое воздействие снижается ещё более. С другой стороны, продолжающийся рост возможностей моделей свидетельствует о том, что как охват задач, так и успешность задач могут увеличиться, что, в свою очередь, может усилить эффекты на производительность.
1 При изучении корреляции между примитивами и O*NET мы ограничиваемся задачами, встречающимися как минимум в 100 диалогах, для снижения ошибки измерения. В анализе охвата мы используем все задачи выше порога конфиденциальности в 15.
2 Наше онлайн-приложение доступно по адресу https://huggingface.co/datasets/Anthropic/EconomicIndex.
3 См. также Tomlinson et al (2025) для связанного показателя применимости ИИ.
4 Мы генерируем эмбеддинги для каждого описания задачи с помощью предобученного sentence-трансформера (all-mpnet-base-v2) и предсказываем уровень образования с помощью Ridge-регрессии.
5 С другой стороны, некоторые исторические данные свидетельствуют о том, что когда технологии, автоматизирующие рабочие задачи, появляются в патентных данных, занятость и заработная плата впоследствии снижаются для подверженных профессий (Webb 2020).
6 Когда мы впервые оценивали совокупные последствия использования Claude для производительности, мы опирались на выборку из 100 тыс. диалогов Claude.ai за осень 2025 года. На основе набора задач, для которых мы наблюдали ускорения, мы оценили, что производительность труда может быть на 1,8 процентного пункта выше в год в течение следующего десятилетия. Расширение выборки до 1 млн наблюдений означает, что нам необходимо определиться с тем, как обращаться с очень редко встречающимися задачами — которые весьма распространены, учитывая, что использование следует степенному закону, как мы документировали в прошлом отчёте. Мы выбираем порог 0,02%, поскольку он воспроизводит наши предыдущие результаты для выборки диалогов Claude.ai. По соображениям конфиденциальности мы анализируем только задачи с не менее чем 15 наблюдениями, что подразумевает порог 0,015% для выборки в 100 тыс. Таким образом, наши результаты внутренне согласованы по выборкам. Если не накладывать ограничений на нашу выборку в 1 млн и предполагать прирост эффективности для любой задачи в нашей выборке — даже с 15 наблюдениями из миллиона — подразумеваемый совокупный рост производительности труда в следующем десятилетии составил бы примерно 5 процентных пунктов в год — механический рост на основе значительно большего набора включённых задач.
7 Как и прежде, этот результат основан на применении теоремы Хультена к шокам производительности на уровне задач и предположении о том, что соответствующий разовый прирост совокупной факторной производительности реализуется в течение десятилетия наряду с эффектами углубления капитала. 8 Напомним, что для агрегирования до подразумеваемой производительности труда мы рассчитываем прирост эффективности на уровне задач как логарифмическую разницу между временем человека без ИИ и с ИИ. Безусловно, существуют и другие способы корректировки на надёжность задач. Если задачи в нашей выборке состоят из подзадач с разнородной применимостью ИИ и работники оптимально используют ИИ только для подзадач, где он эффективен, то масштабирование прироста эффективности на процент успешности отражает экстенсивную маржу внедрения ИИ внутри задачи.
9 Мы используем производственную функцию CES (с постоянной эластичностью замещения) для агрегирования экономии времени на уровне задач в общеэкономические эффекты на производительность. Параметр эластичности σ определяет, насколько легко работники могут замещать одну задачу другой. При σ = 1 мы применяем теорему Хультена напрямую: совокупный прирост производительности равен взвешенной по доле заработной платы сумме логарифмов ускорений по задачам. При σ ≠ 1 мы используем двухуровневое агрегирование: сначала внутри каждой профессии мы вычисляем ускорение на уровне профессии как CES-агрегат ускорений задач, взвешенных по долям времени, с ρ = (σ−1)/σ. Затем мы применяем теорему Хультена к этим ускорениям на уровне профессий. При σ < 1 (комплементы) прирост производительности ограничивается задачами с наименьшими ускорениями. При σ > 1 (субституты) работники могут специализироваться на задачах, где ИИ обеспечивает наибольшее ускорение, усиливая совокупный прирост. Для задач без наблюдаемых данных об ускорении ИИ мы предполагаем отсутствие изменения производительности. Мы благодарим Pascual Restrepo за предложение этого конкретного упражнения.
Заключительные замечания
Четвёртый отчёт Anthropic Economic Index вводит экономические примитивы — базовые характеристики использования ИИ — которые показывают, как Claude используется как потребителями, так и компаниями. Мы используем Claude для оценки степени, в которой использование варьируется по этим измерениям; эти метрики направленно точны и в совокупности предоставляют важные сигналы, даже если отдельные классификации несовершенны.
Наши выводы имеют значительные последствия для того, как ИИ перестроит экономику и рынки труда. В частности, Claude используется чаще и, по-видимому, обеспечивает больший прирост производительности для задач, требующих более высокого уровня образования. Если эти задачи сократятся для американских работников, чистым эффектом может стать деквалификация профессий. Однако эти последствия критически зависят от комплементарности задач и от того, может ли рост производительности в определённой задаче увеличить спрос на неё.
На глобальном уровне сильная связь между подушевым доходом и паттернами использования — где страны с более высоким доходом используют Claude коллаборативно, а страны с более низким доходом сосредоточены на учёбе и конкретных приложениях — свидетельствует о том, что влияние ИИ будет опосредовано существующими институциональными структурами, а не будет развиваться единообразно. Паттерны географического распространения подтверждают эту картину. Внутри США подушевое использование немного сконвергировало; в глобальном масштабе распространение идёт медленнее. В сочетании с обусловленными доходом различиями в том, как используется ИИ, это ставит вопрос о том, сократит или увеличит ИИ международные экономические разрывы.
Не менее важны, чем задокументированные здесь паттерны, потенциальные изменения в этом и последующих отчётах. По мере развития возможностей ИИ процент успешности Claude может вырасти, паттерны использования могут демонстрировать большую автономию, пользователи могут браться за новые и более сложные задачи, а задачи, поддающиеся автоматизации, могут перейти из интерактивного чата в развёртывание через API. Мы будем отслеживать эту динамику на протяжении времени, обеспечивая лонгитюдный взгляд на роль ИИ в экономике.
Опираясь на предыдущие публикации, этот выпуск значительно расширяет как охват, так и прозрачность данных об использовании, которыми мы делимся, включая классификации задач по новым измерениям и региональные разбивки на глобальном уровне впервые. Мы публикуем эти данные, чтобы дать возможность исследователям, журналистам и общественности исследовать новые вопросы об экономическом воздействии ИИ, которые могут стать эмпирической основой для политических решений.
Готовность пользователей экспериментировать с ИИ и создание регуляторами контекста, способствующего как безопасности, так и инновациям, определят, как ИИ трансформирует экономику. Чтобы ИИ приносил пользу пользователям во всём мире, одного лишь расширения доступа недостаточно — развитие человеческого капитала, обеспечивающего эффективное использование, особенно в странах с более низким доходом, является необходимым.
Авторы и благодарности
Блок первых авторов*:
Ruth Appel, Maxim Massenkoff, Peter McCrory
*Ведущие авторы отчёта
Блок вторых авторов:
Miles McCain, Ryan Heller, Tyler Neylon, Alex Tamkin
Благодарности
Xabi Azagirre, Tim Belonax, Keir Bradwell, Andy Braden, Dexter Callender III, Sylvie Carr, Miriam Chaum, Ronan Davy, Evan Frondorf, Deep Ganguli, Kunal Handa, Andrew Ho, Rebecca Jacobs, Owen Kaye-Kauderer, Bianca Lindner, Kelly Loftus, James Ma, Jennifer Martinez, Jared Mueller, Kelsey Nanan, Kim O'Rourke, Dianne Penn, Sarah Pollack, Ankur Rathi, Zoe Richards, Alexandra Sanderford, David Saunders, Michael Sellitto, Thariq Shihipar, Michael Stern, Kim Withee, Mengyi Xu, Tony Zeng, Xiuruo Zhang, Shuyi Zheng, Emily Pastewka, Angeli Jain, Sarah Heck, Jared Kaplan, Jack Clark, Dario Amodei
Цитирование
@online{anthropic2026aeiv4, author = {Ruth Appel and Maxim Massenkoff and Peter McCrory and Miles McCain and Ryan Heller and Tyler Neylon and Alex Tamkin}, title = {Anthropic Economic Index report: economic primitives}, date = {2026-01-15}, year = {2026}, url = {https://www.anthropic.com/research/anthropic-economic-index-january-2026-report}, }
Связанные материалы
2028: Два сценария глобального лидерства в ИИ
Наши взгляды на конкуренцию в области ИИ между США и Китаем.
Обучение Claude причинам
Новое исследование о том, как мы снизили агентное рассогласование.
Natural Language Autoencoders: превращение мыслей Claude в текст
Модели ИИ вроде Claude говорят словами, но думают числами. В этом исследовании мы обучаем Claude переводить свои мысли в читаемый человеком текст.