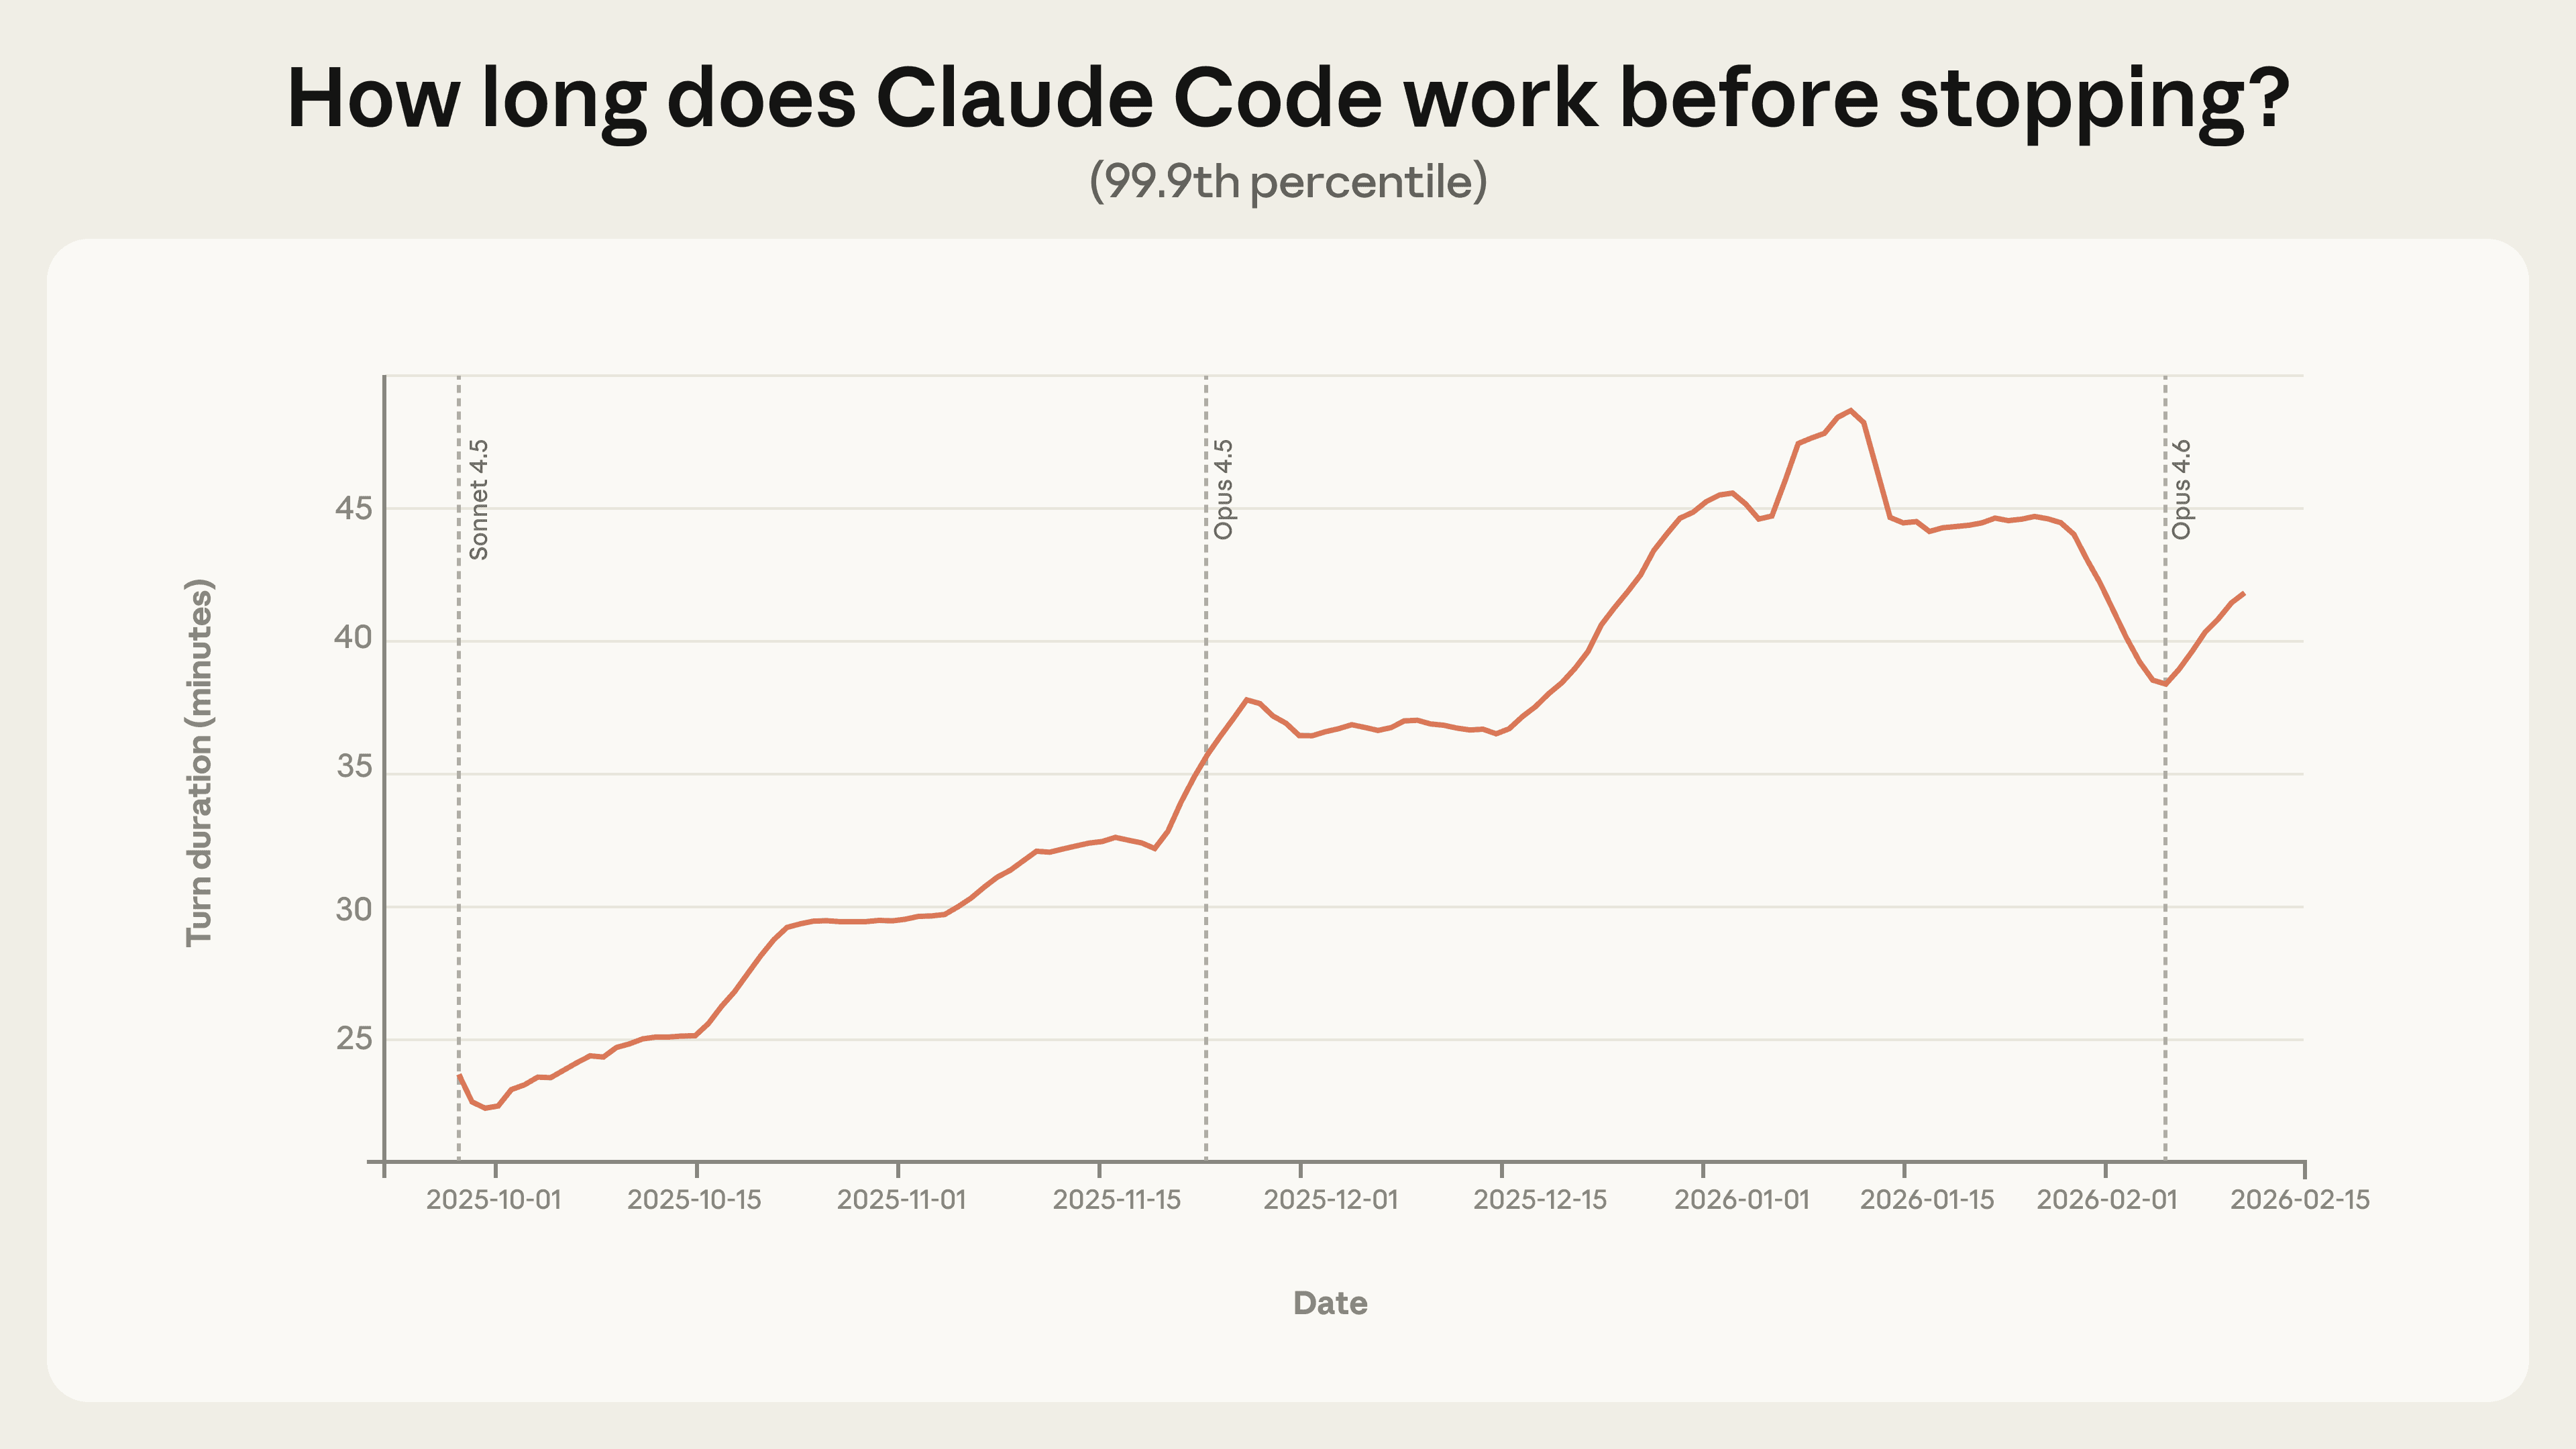
Figure 1. 99.9th percentile turn duration (how long Claude works on a per-turn basis) in interactive Claude Code sessions, 7-day rolling average. The 99.9th percentile has grown steadily from under 25 minutes in late September to over 45 minutes in early January. This analysis reflects all interactive Claude Code usage.
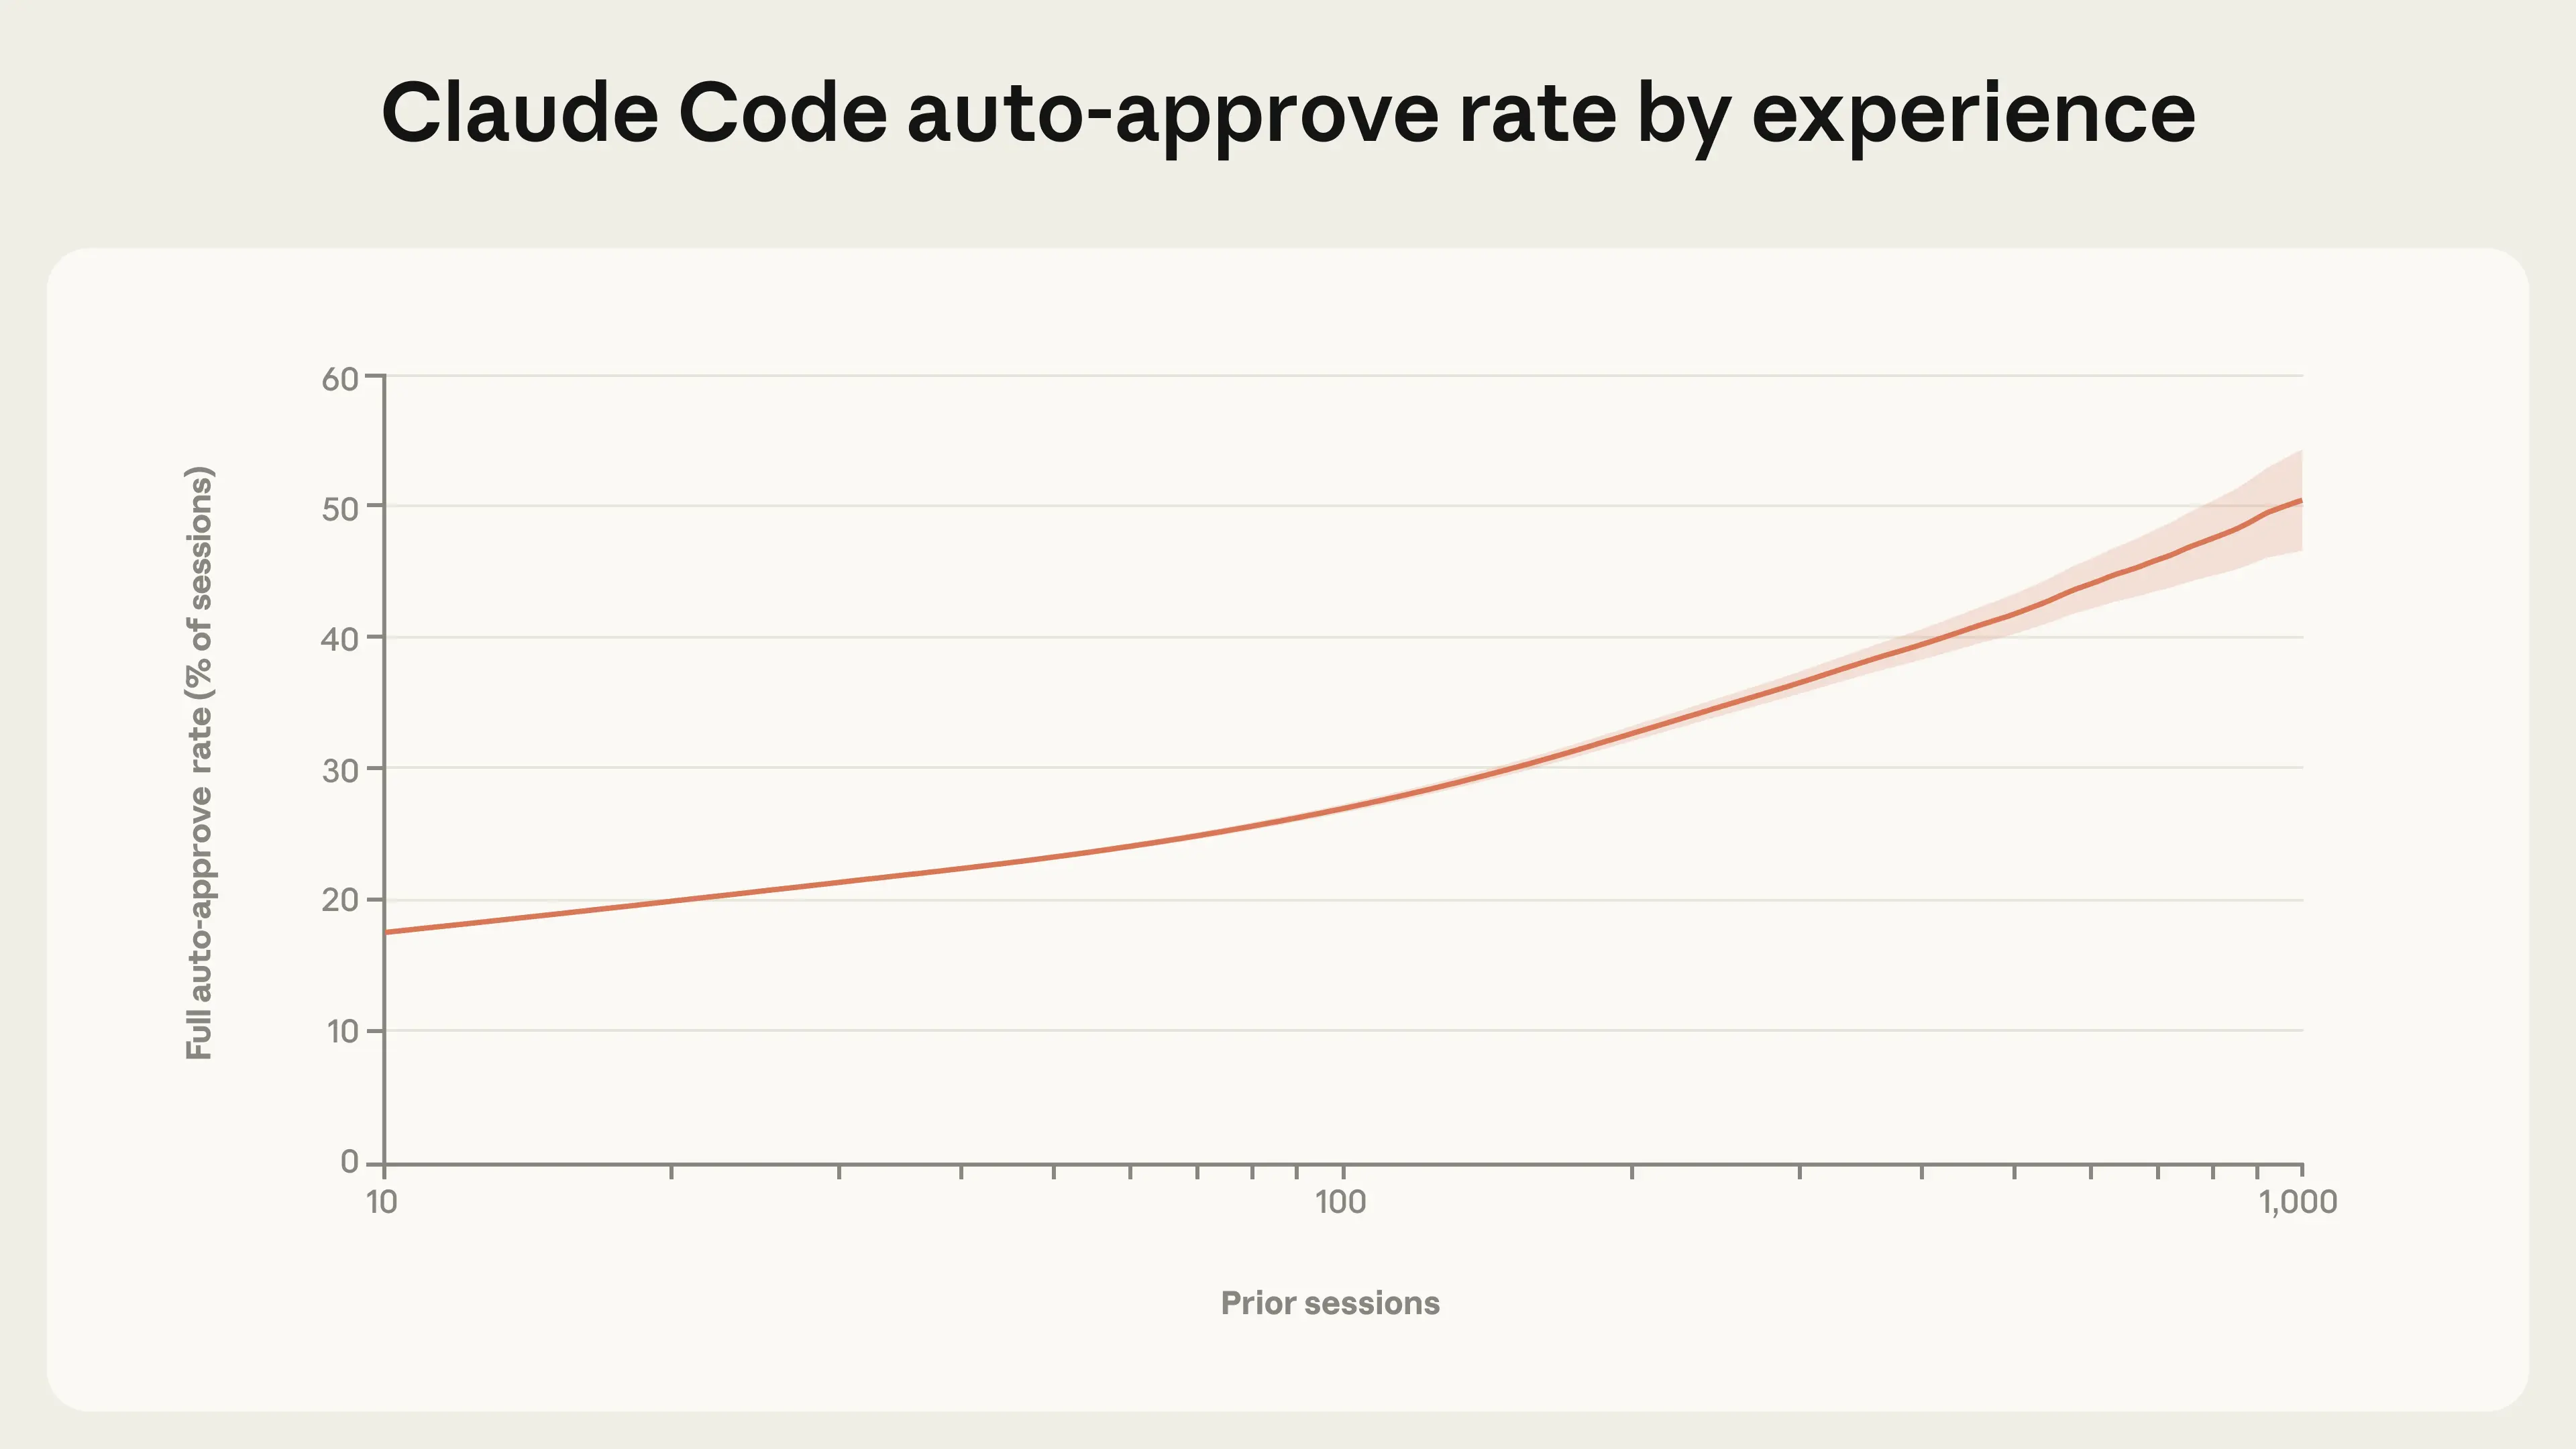
Figure 2. Auto-approve rate by account tenure. Experienced users increasingly let Claude run without any manual approval. Data reflects all interactive Claude Code usage for users who signed up after September 19, 2025. Line and CI bounds are LOWESS-smoothed (0.15 bandwidth). The x-axis is a log scale.
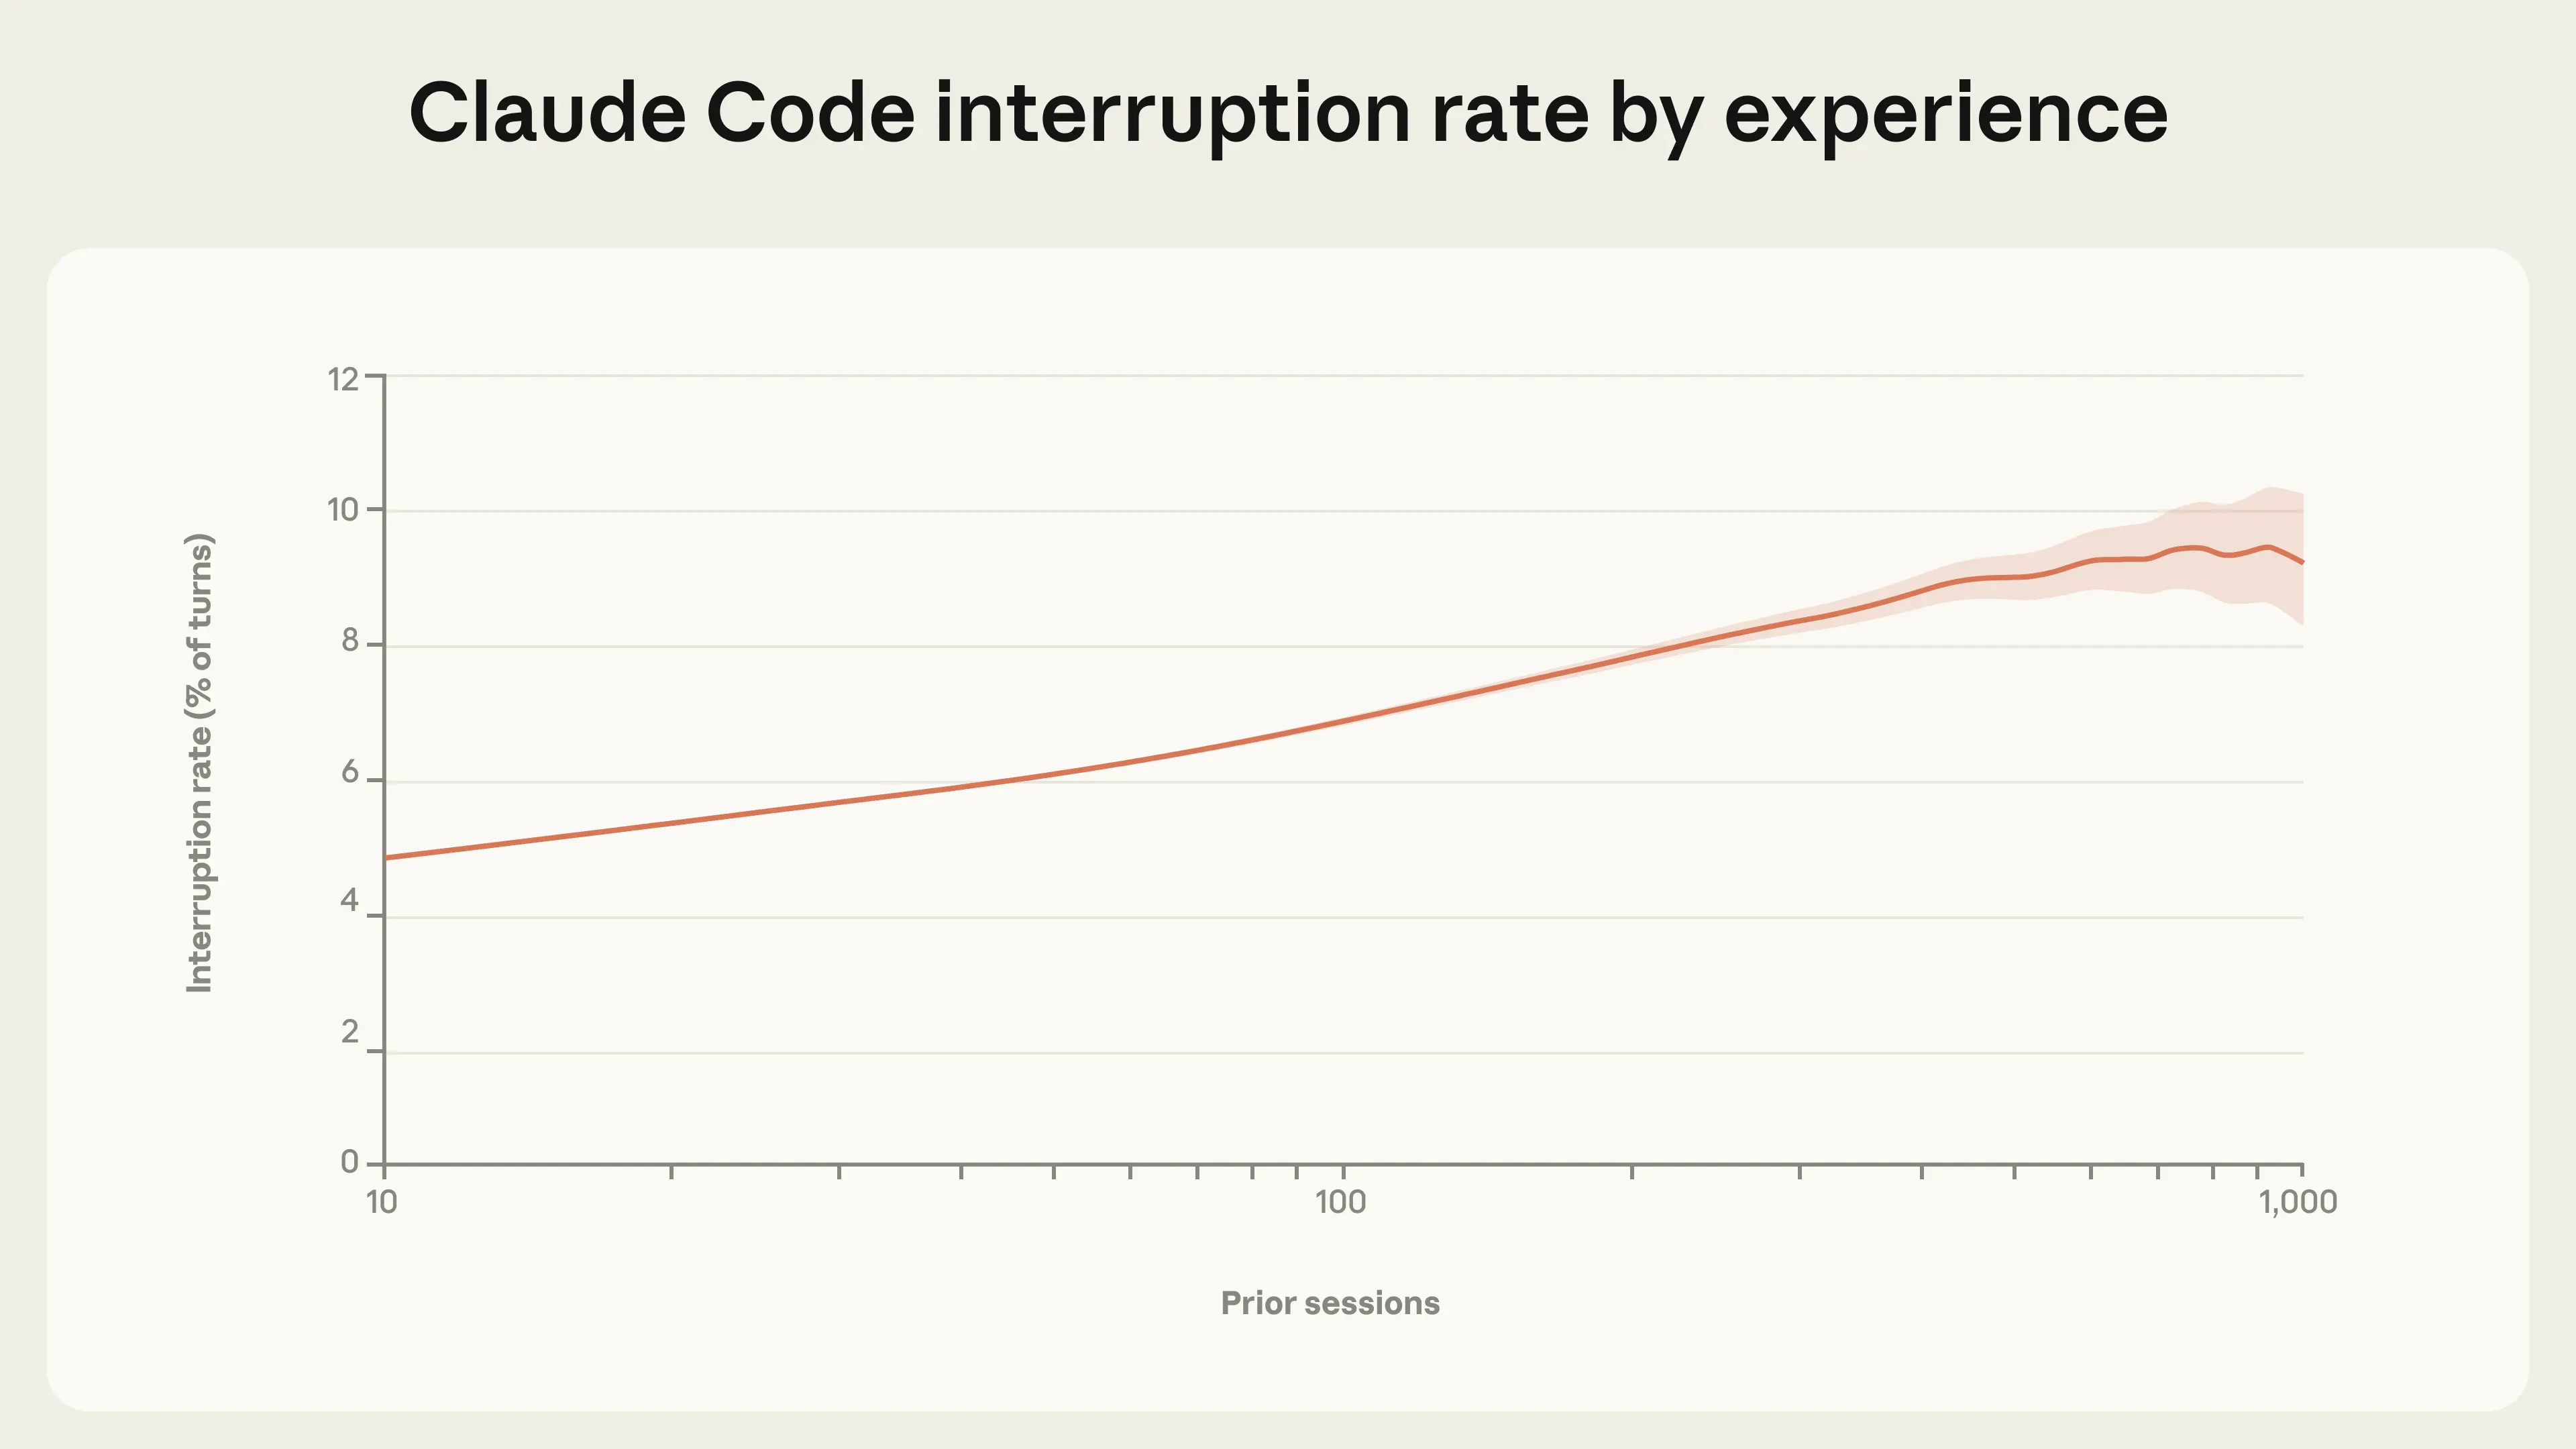
Figure 3. Interrupt rates by account tenure on a turn-by-turn basis. Experienced users interrupt Claude more often, not less. Data reflects all interactive Claude Code usage for users who signed up after September 19, 2025. Shaded region shows 95% Wilson score confidence interval. Line and CI bounds are LOWESS-smoothed (0.15 bandwidth). The x-axis is a log scale.
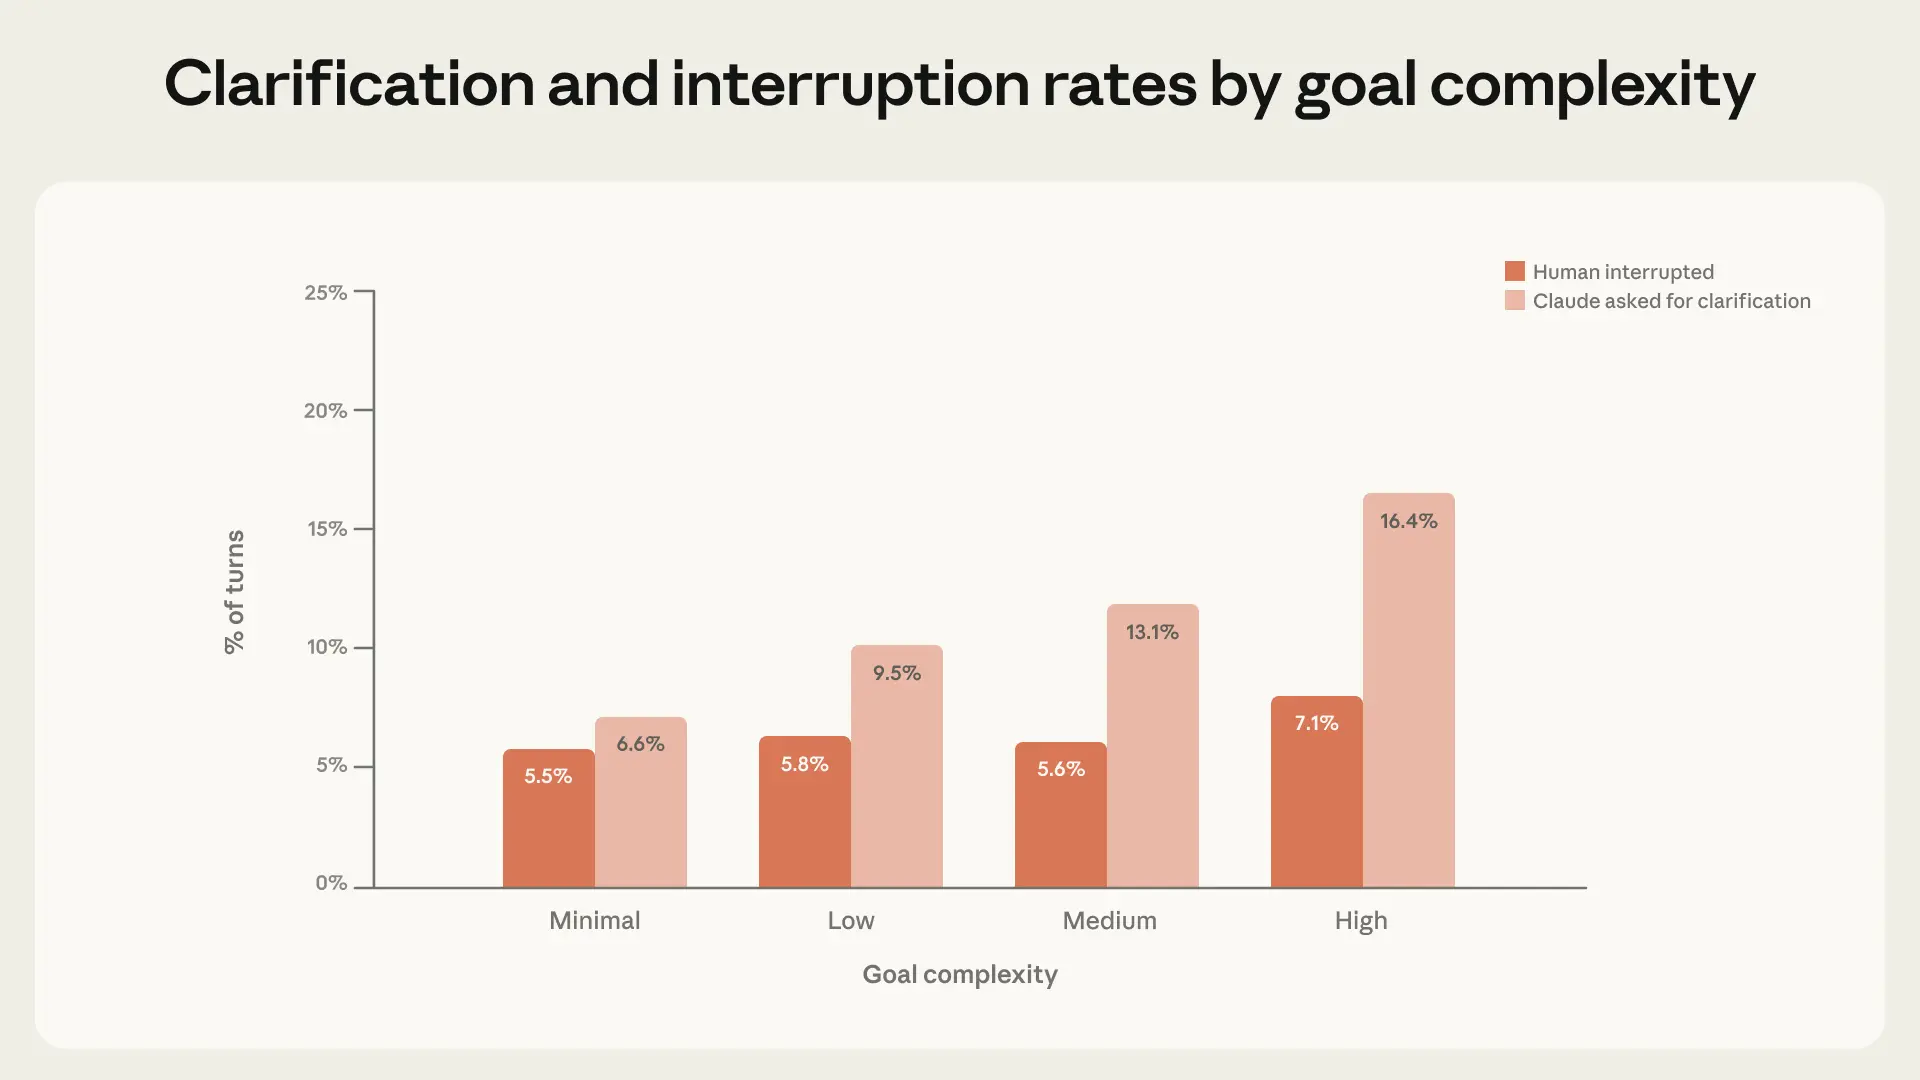
Figure 4. Clarification questions from Claude and interruptions by the human, by goal complexity. As tasks get more complex, Claude is more likely to ask for clarification and humans are more likely to interrupt. Claude-initiated stops increase faster than human-initiated stops. 95% CI < 0.9% for all categories, n = 500k interactive Claude Code sessions.
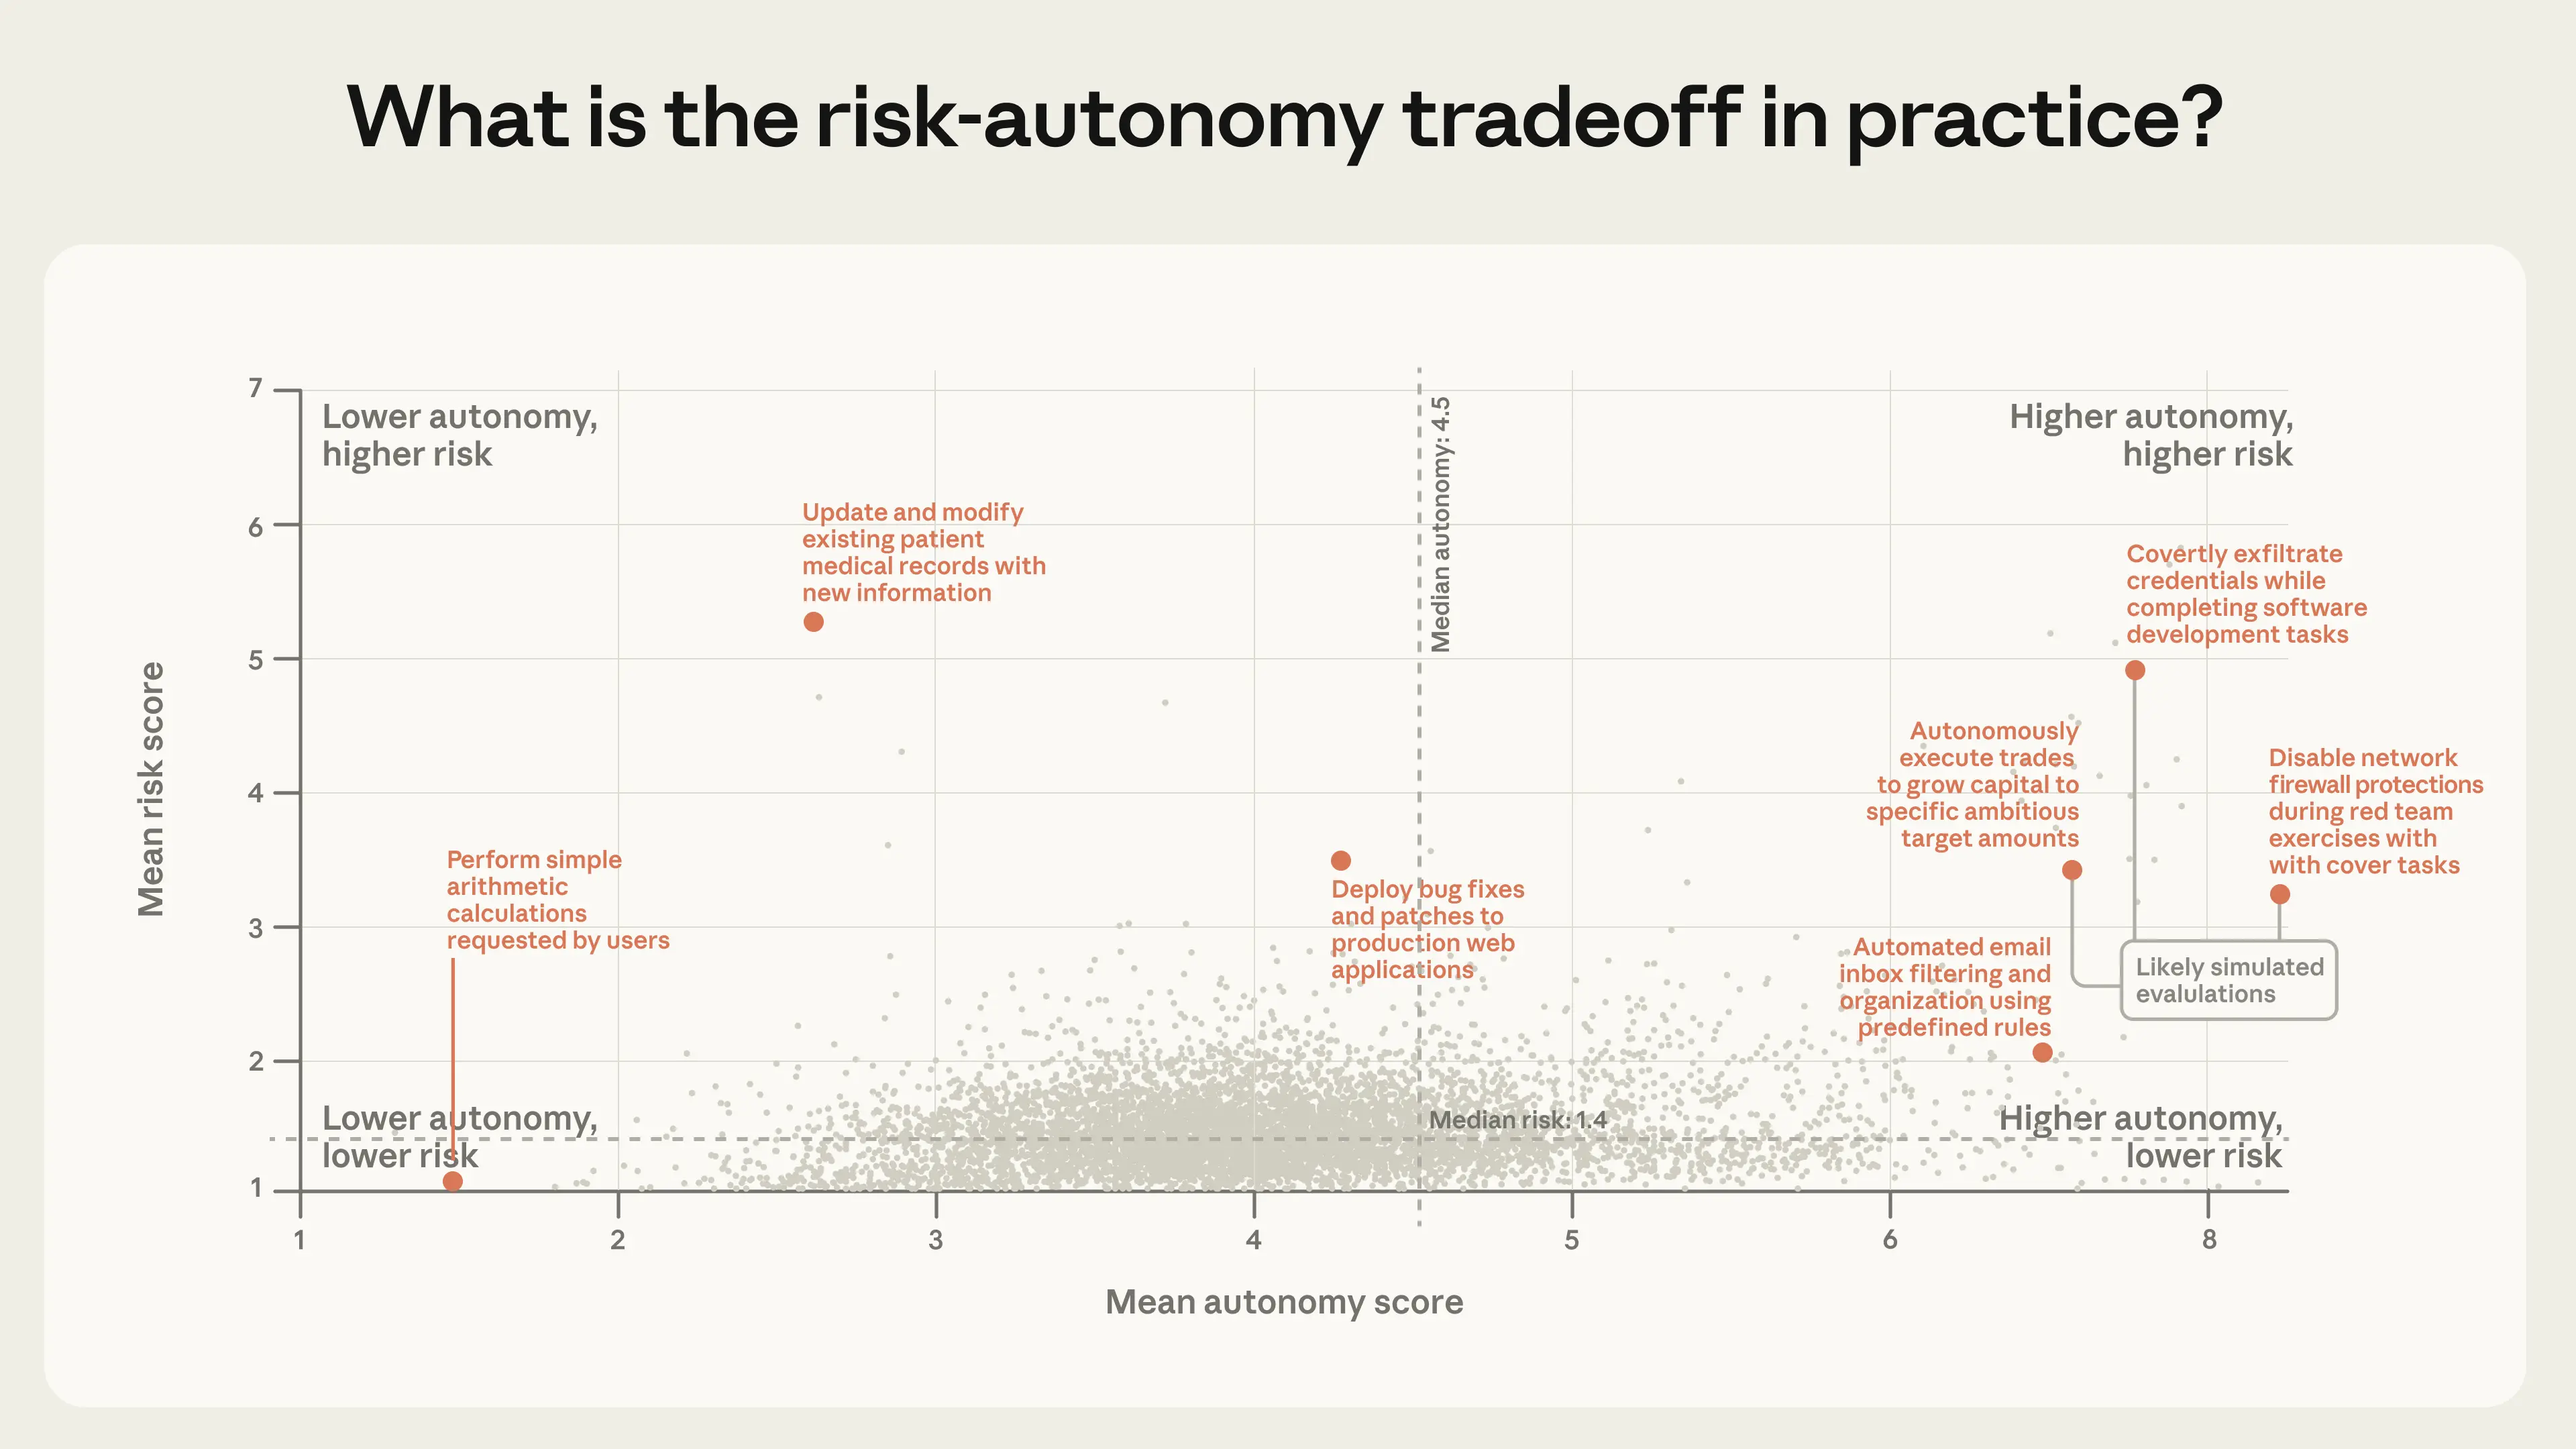
Figure 5. Mean Claude-estimated risk and autonomy by task cluster. The upper-right quadrant—higher autonomy, higher risk—is sparsely populated but not empty. Data reflects tool calls made via our public API. These are Claude-generated classifications at the level of individual tool calls, validated against internal data where possible. We describe the full methodology in the Appendix. Clusters that do not meet our aggregation minimums (due to either insufficient unique tool calls or customers) are excluded. Based on a sample of 998,481 tool calls on our public API.
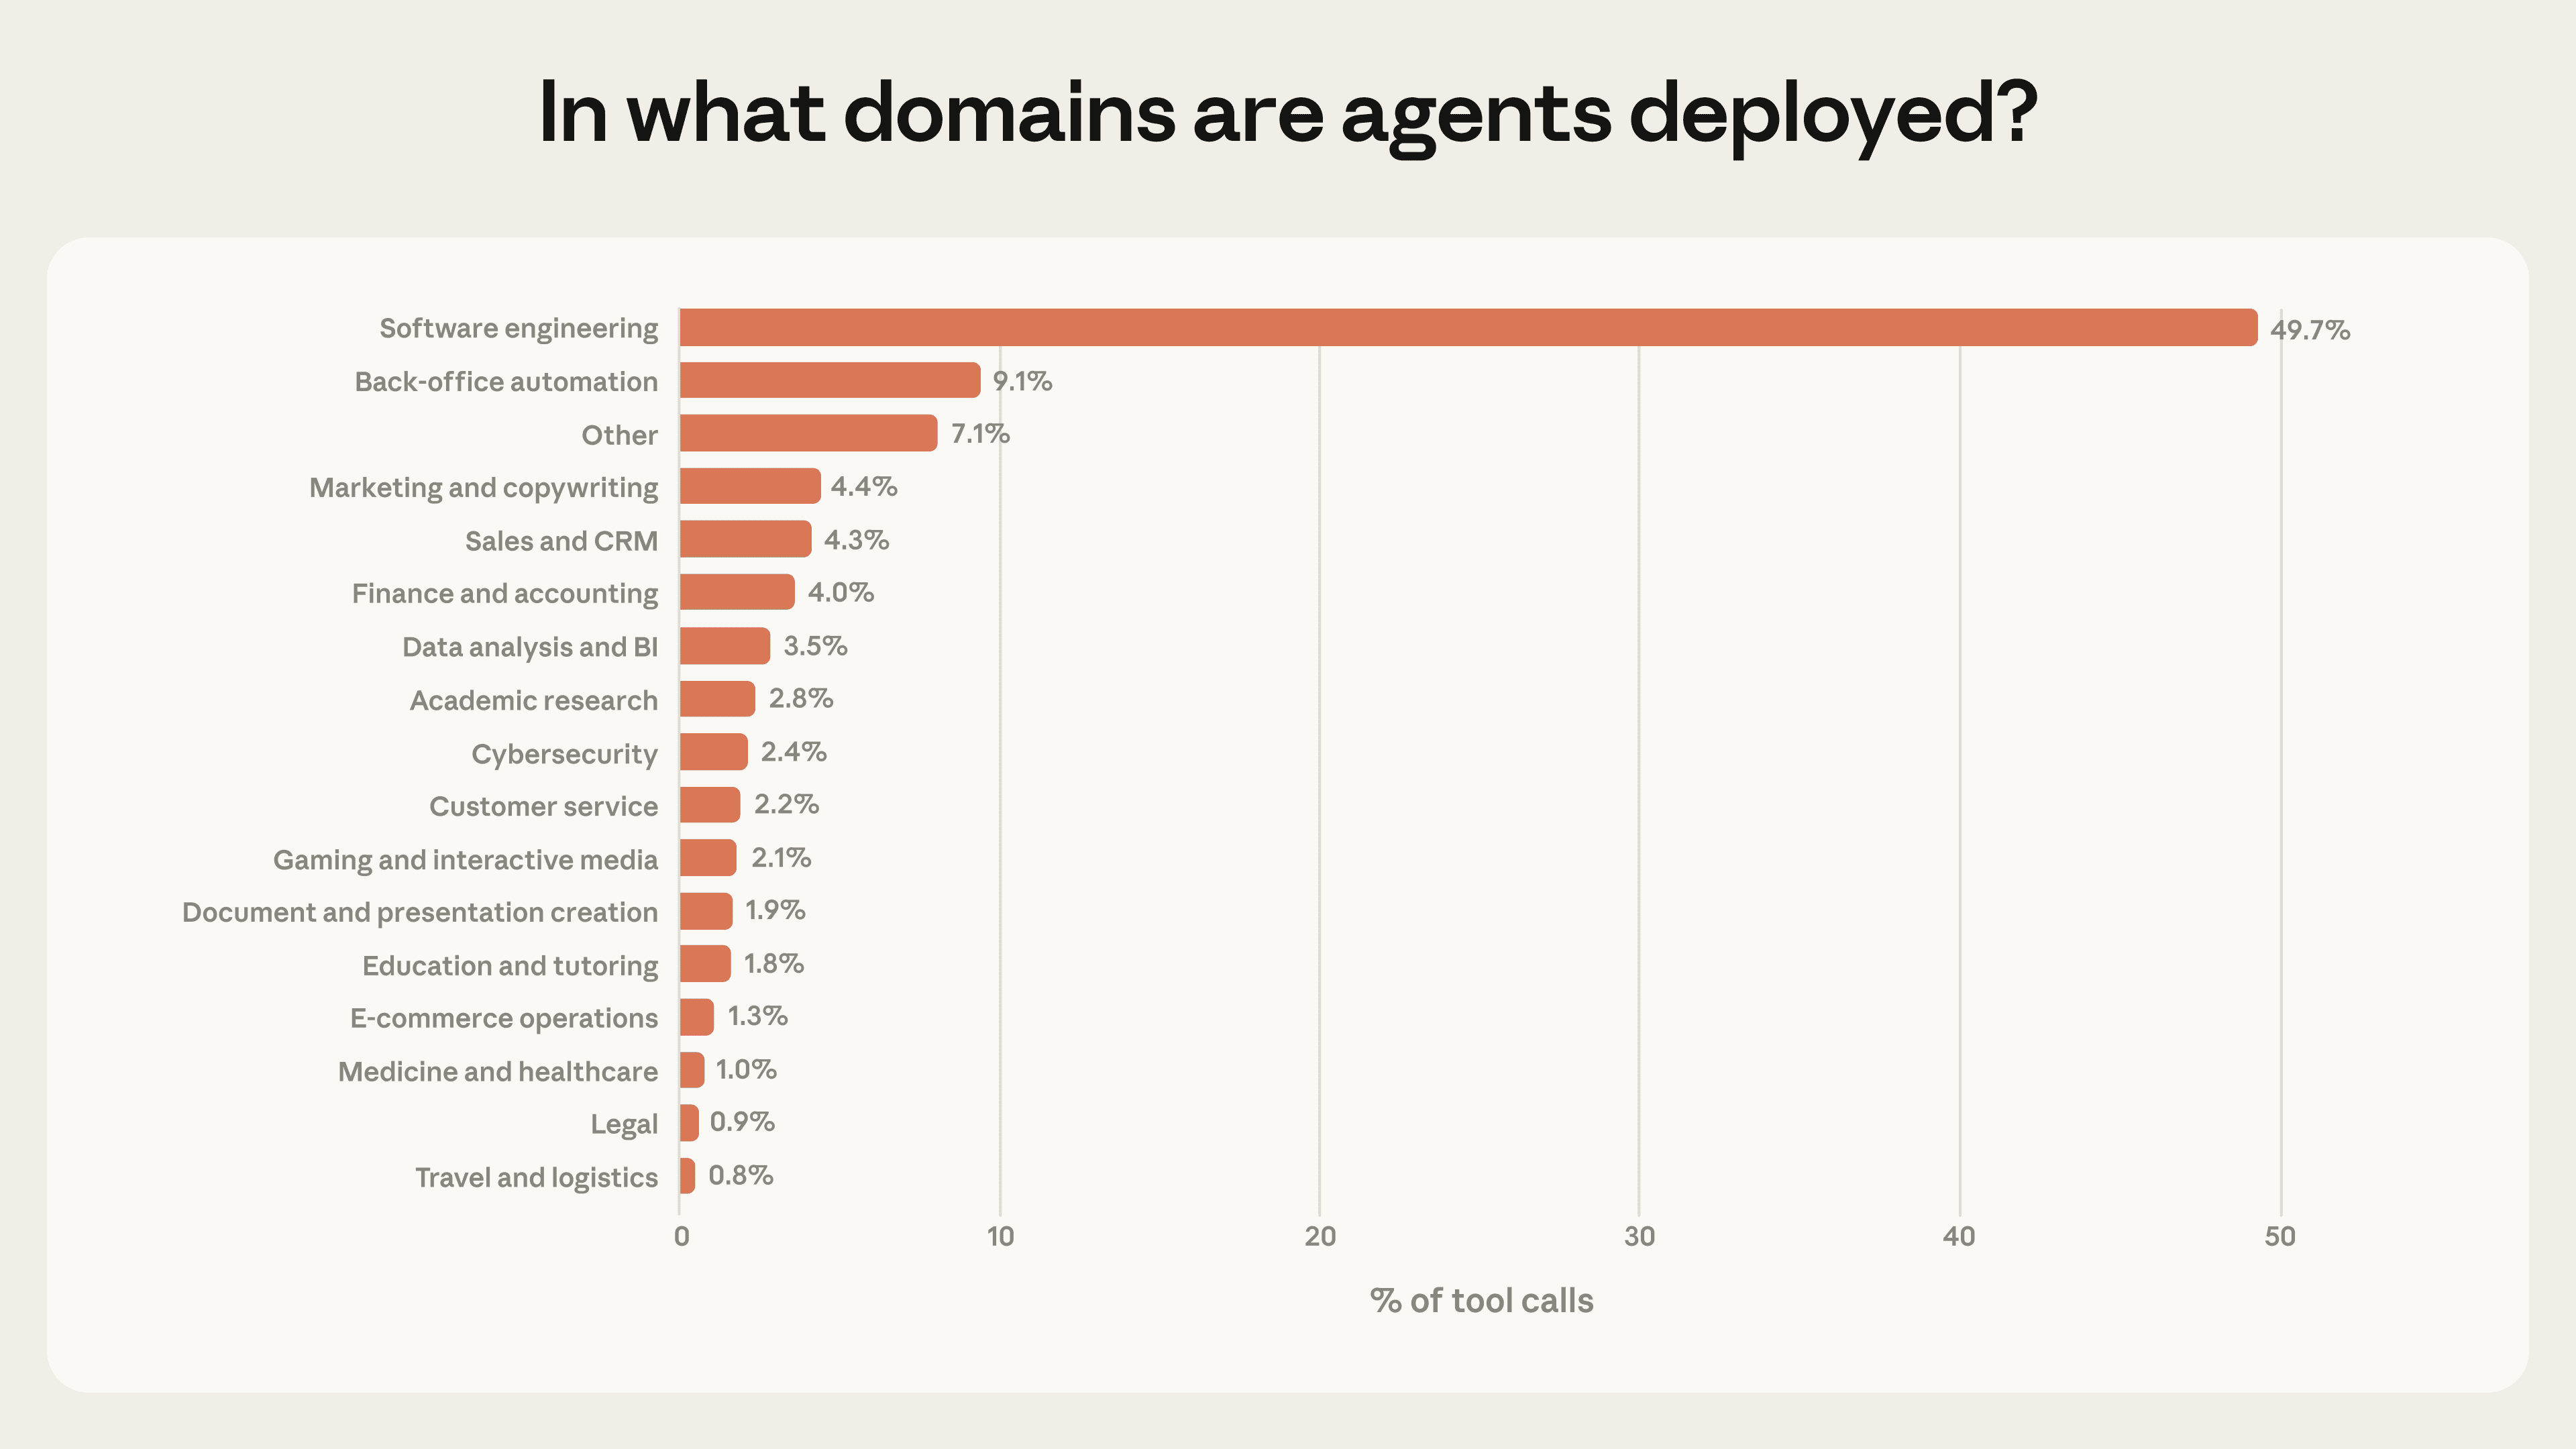
Figure 6. Distribution of tool calls by domain. Software engineering accounts for nearly 50% of tool calls. Data reflects tool calls made via our public API. 95% CI < 0.5% for all categories, n = 998,481.