Introducing Anthropic Interviewer: What 1,250 professionals told us about working with AI
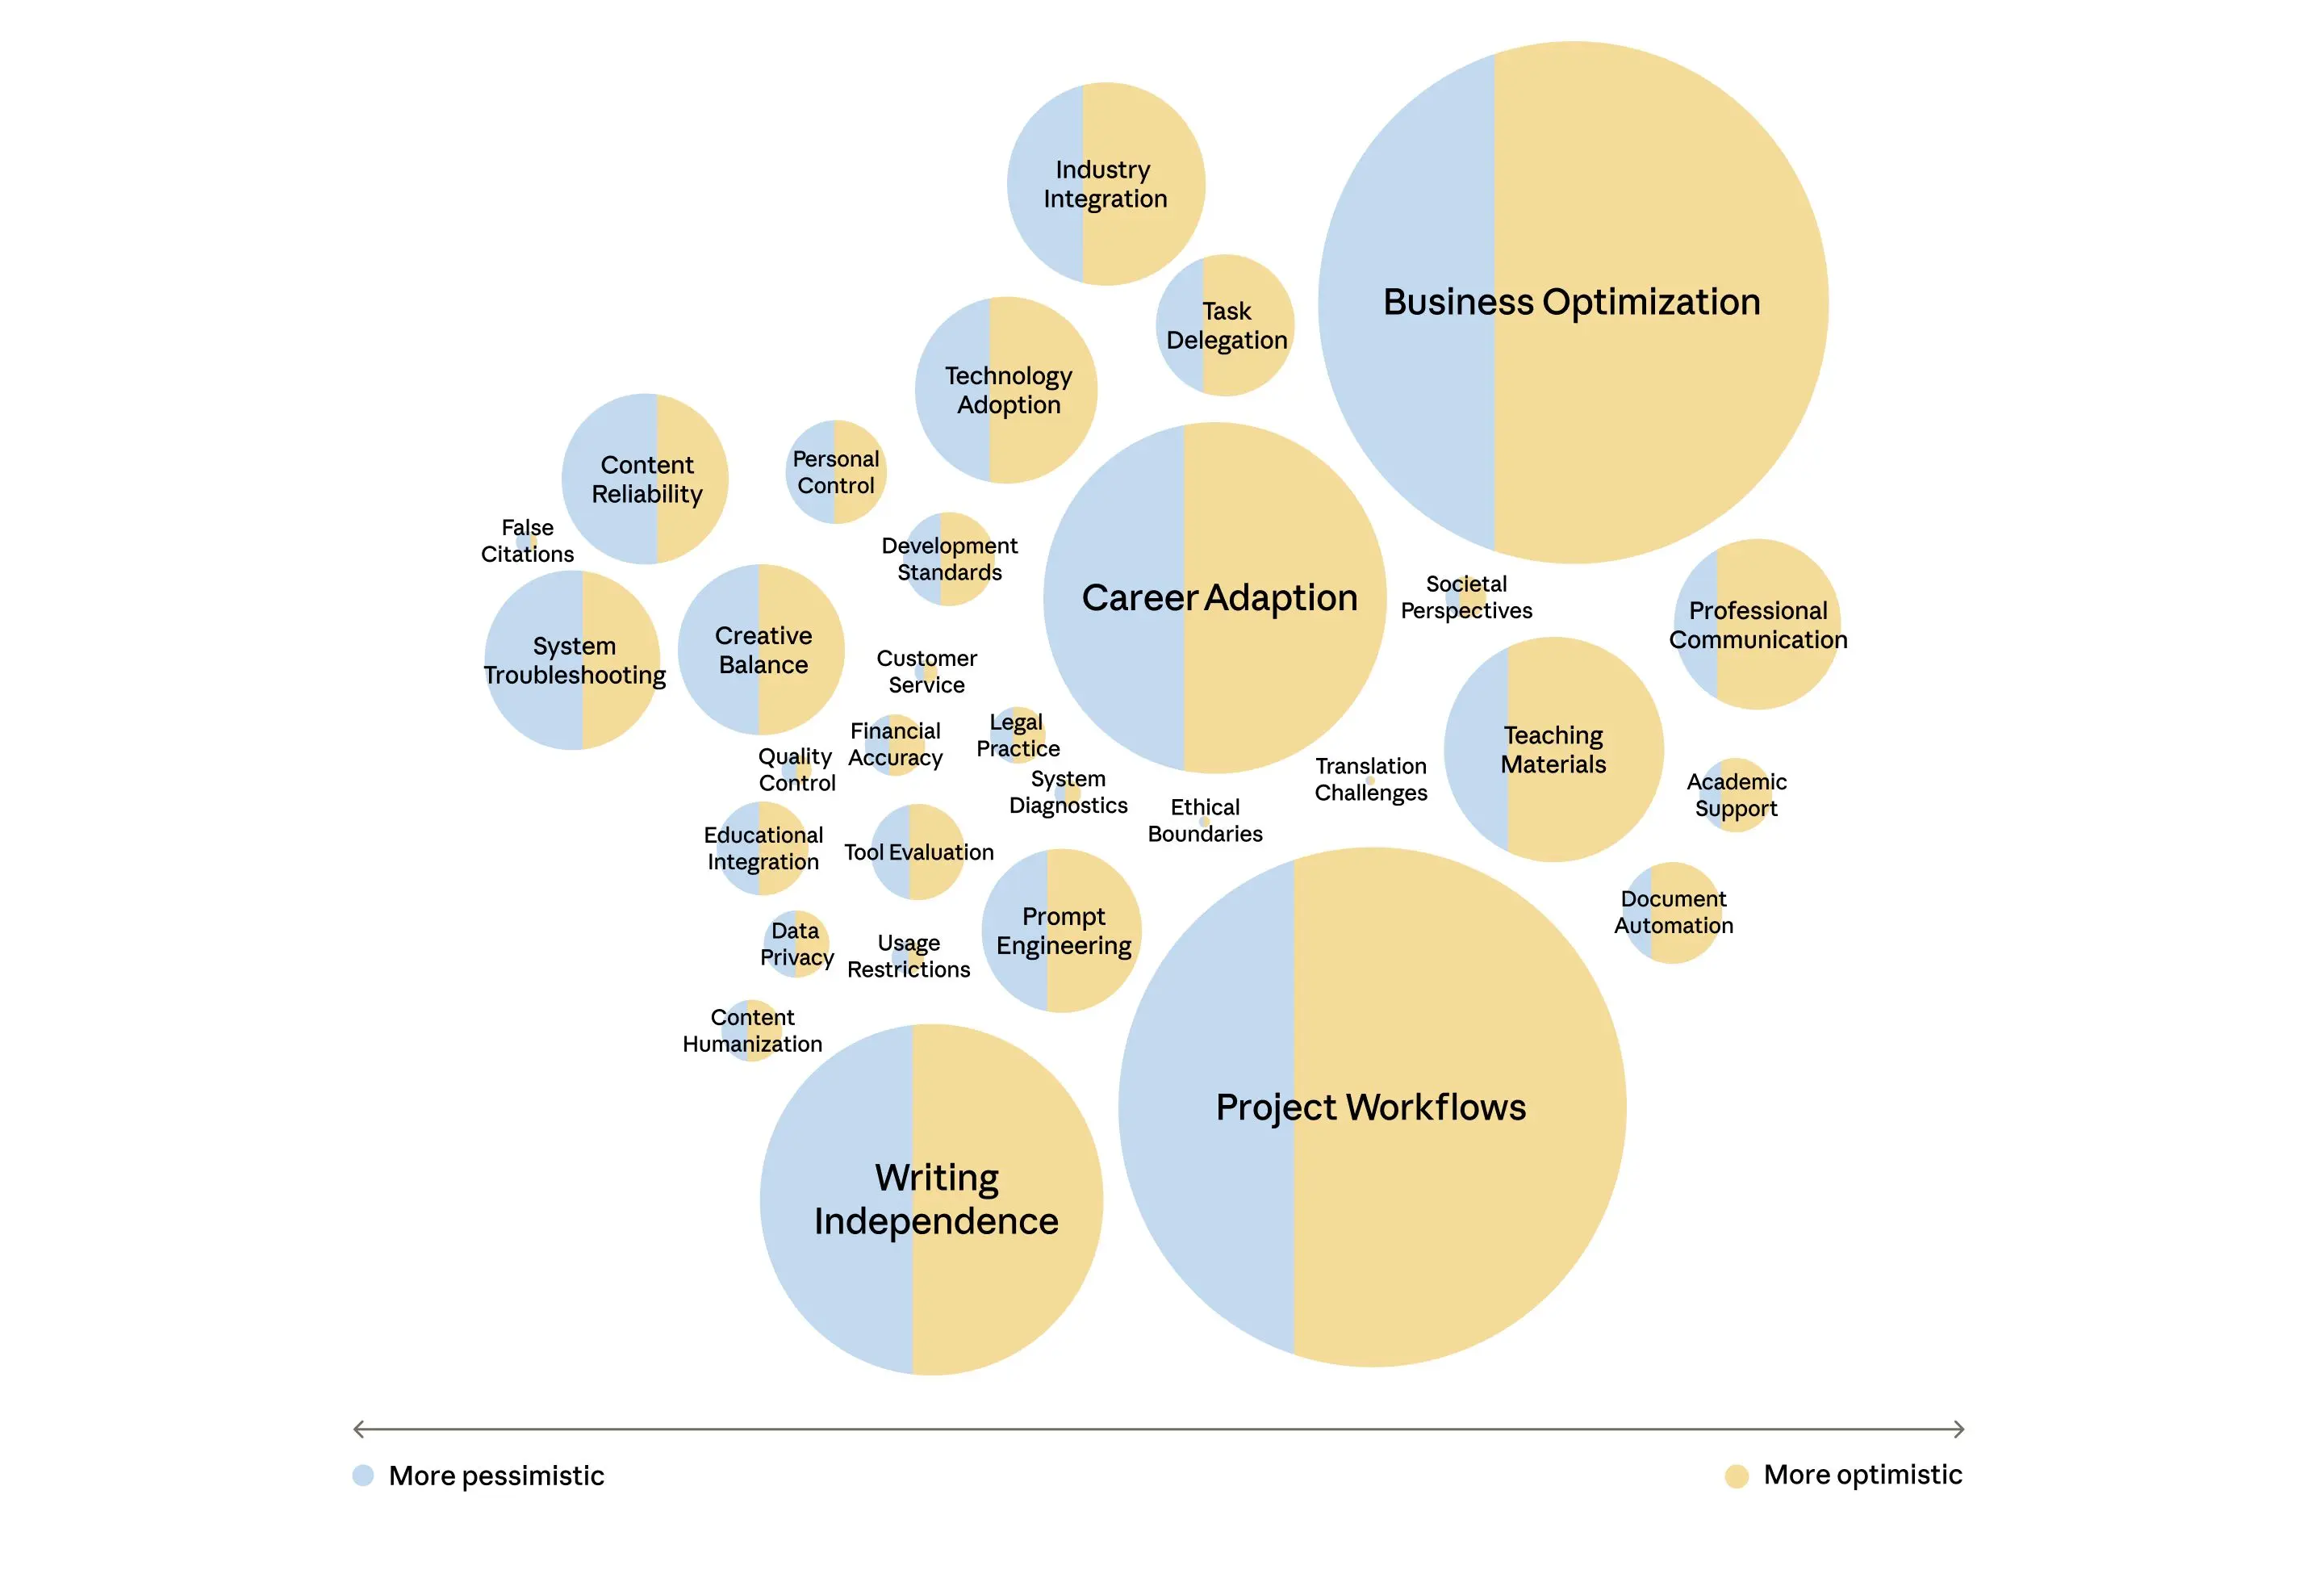
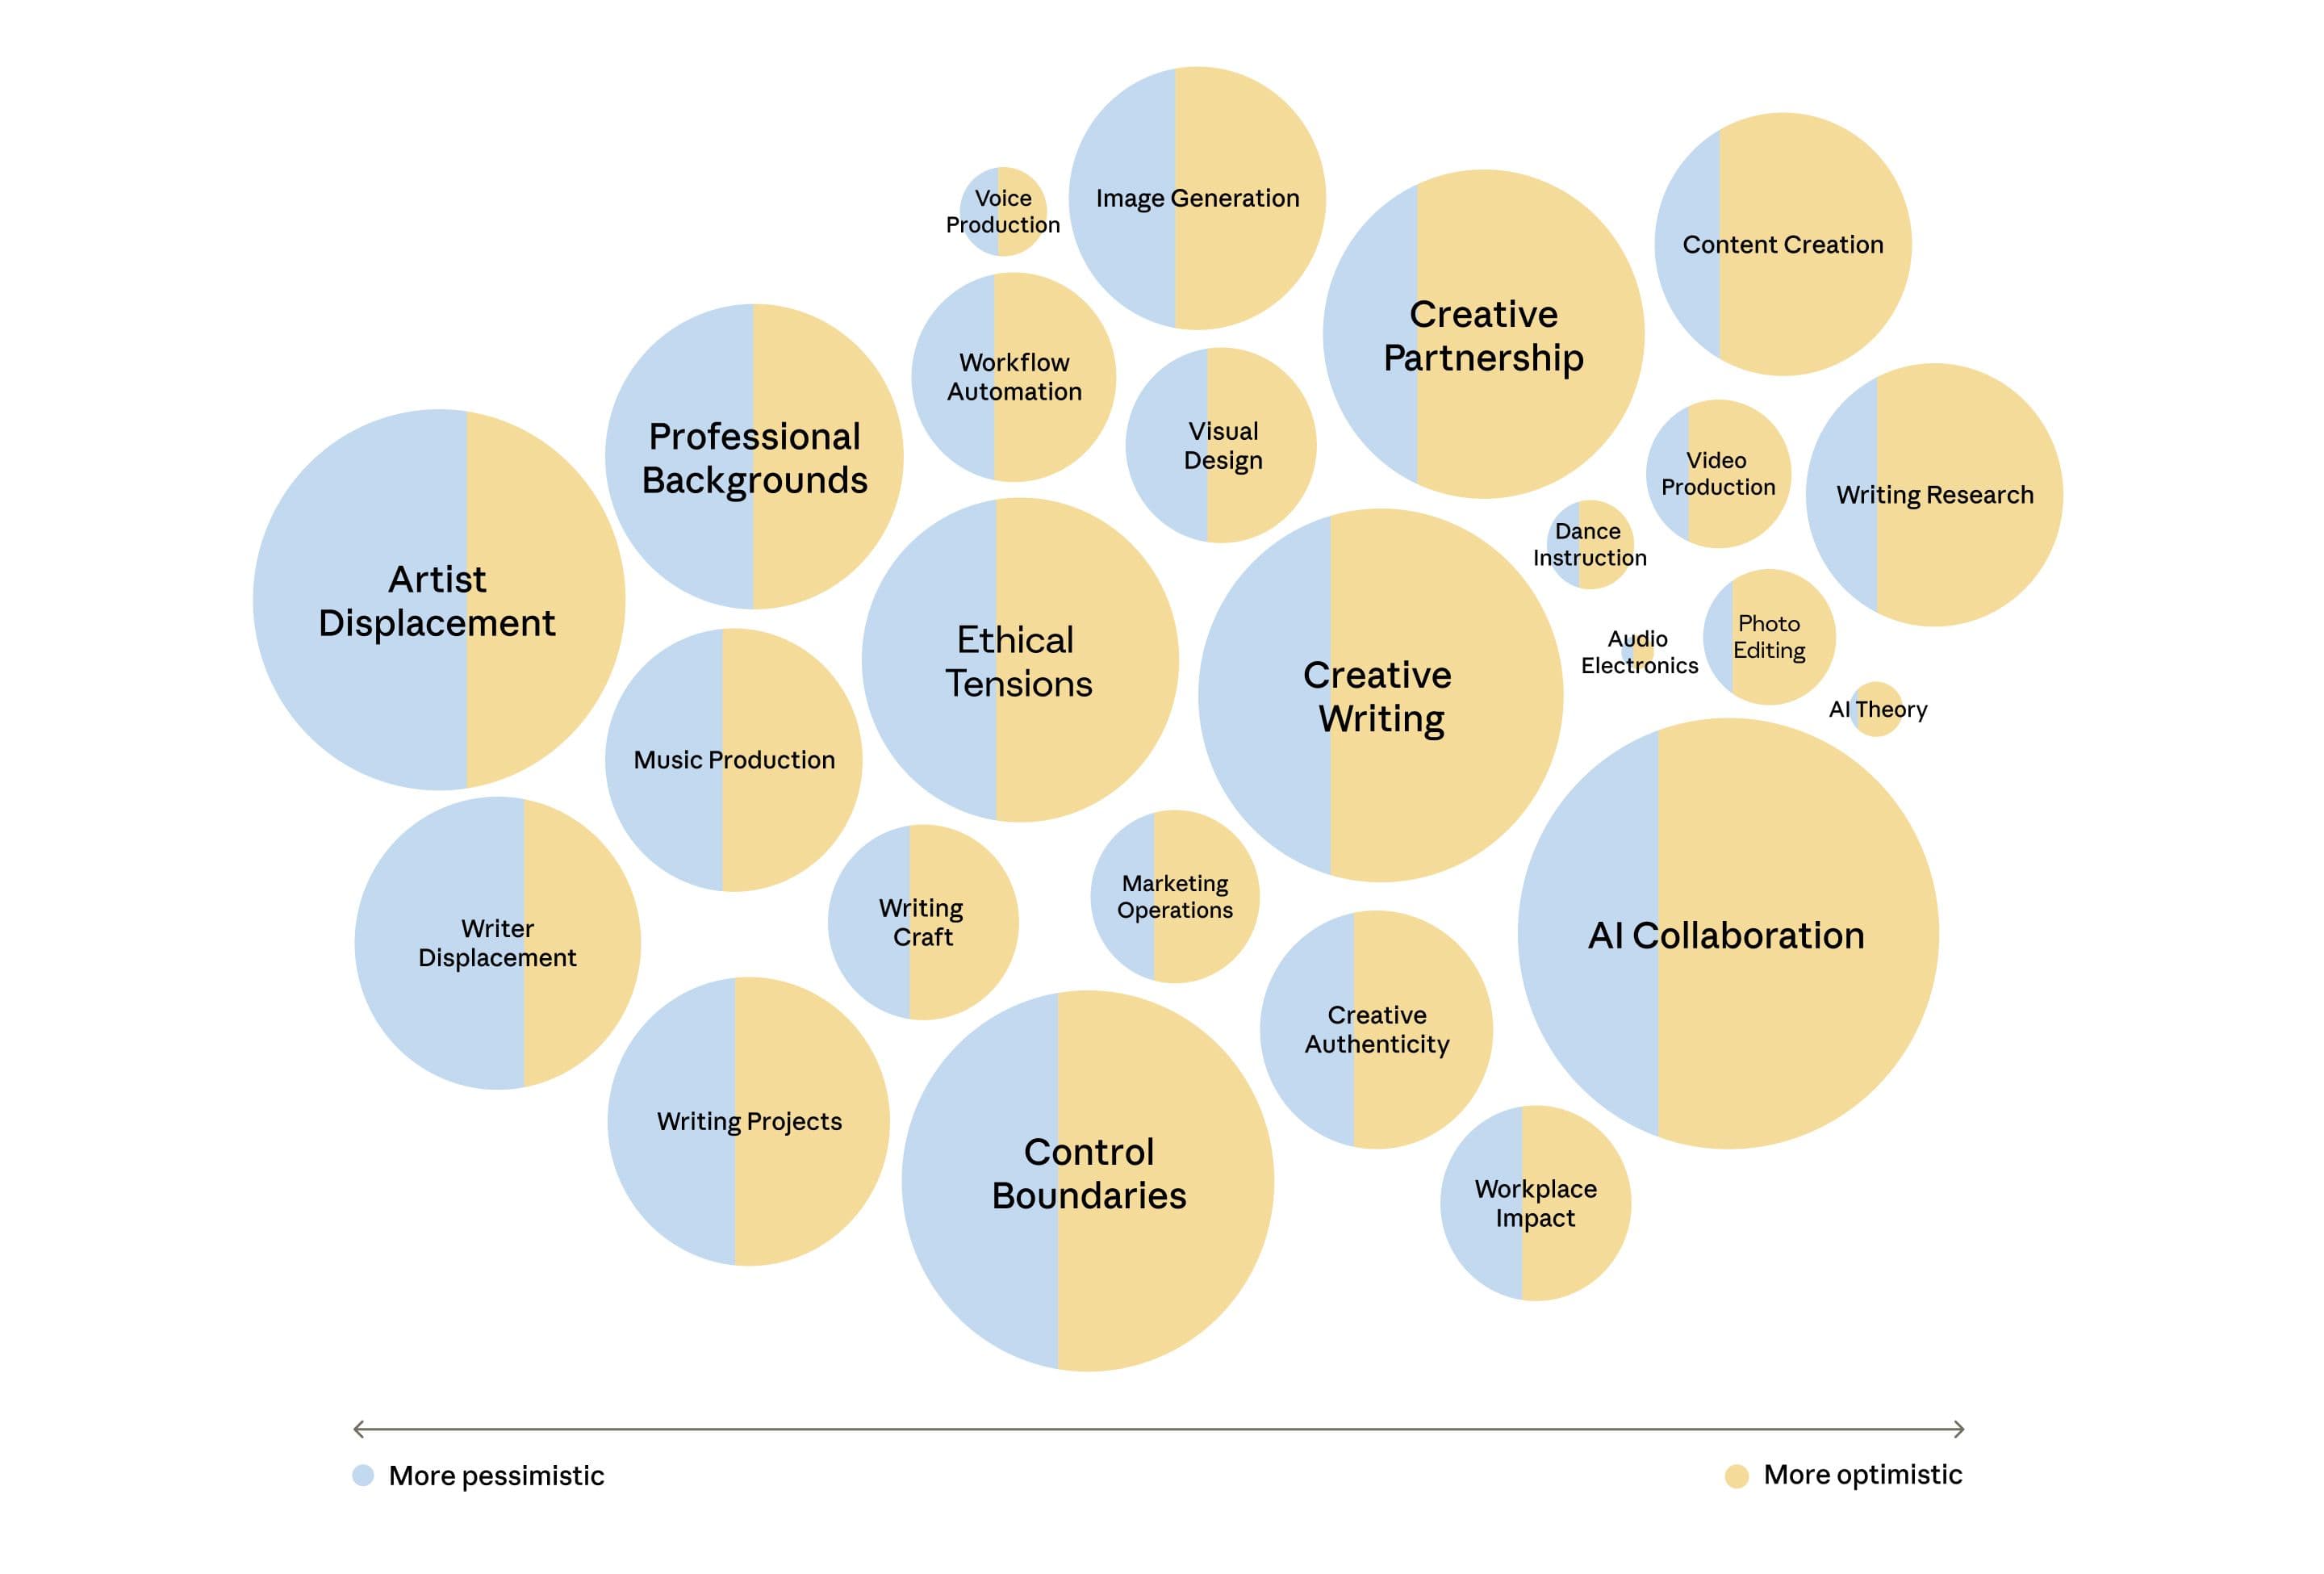
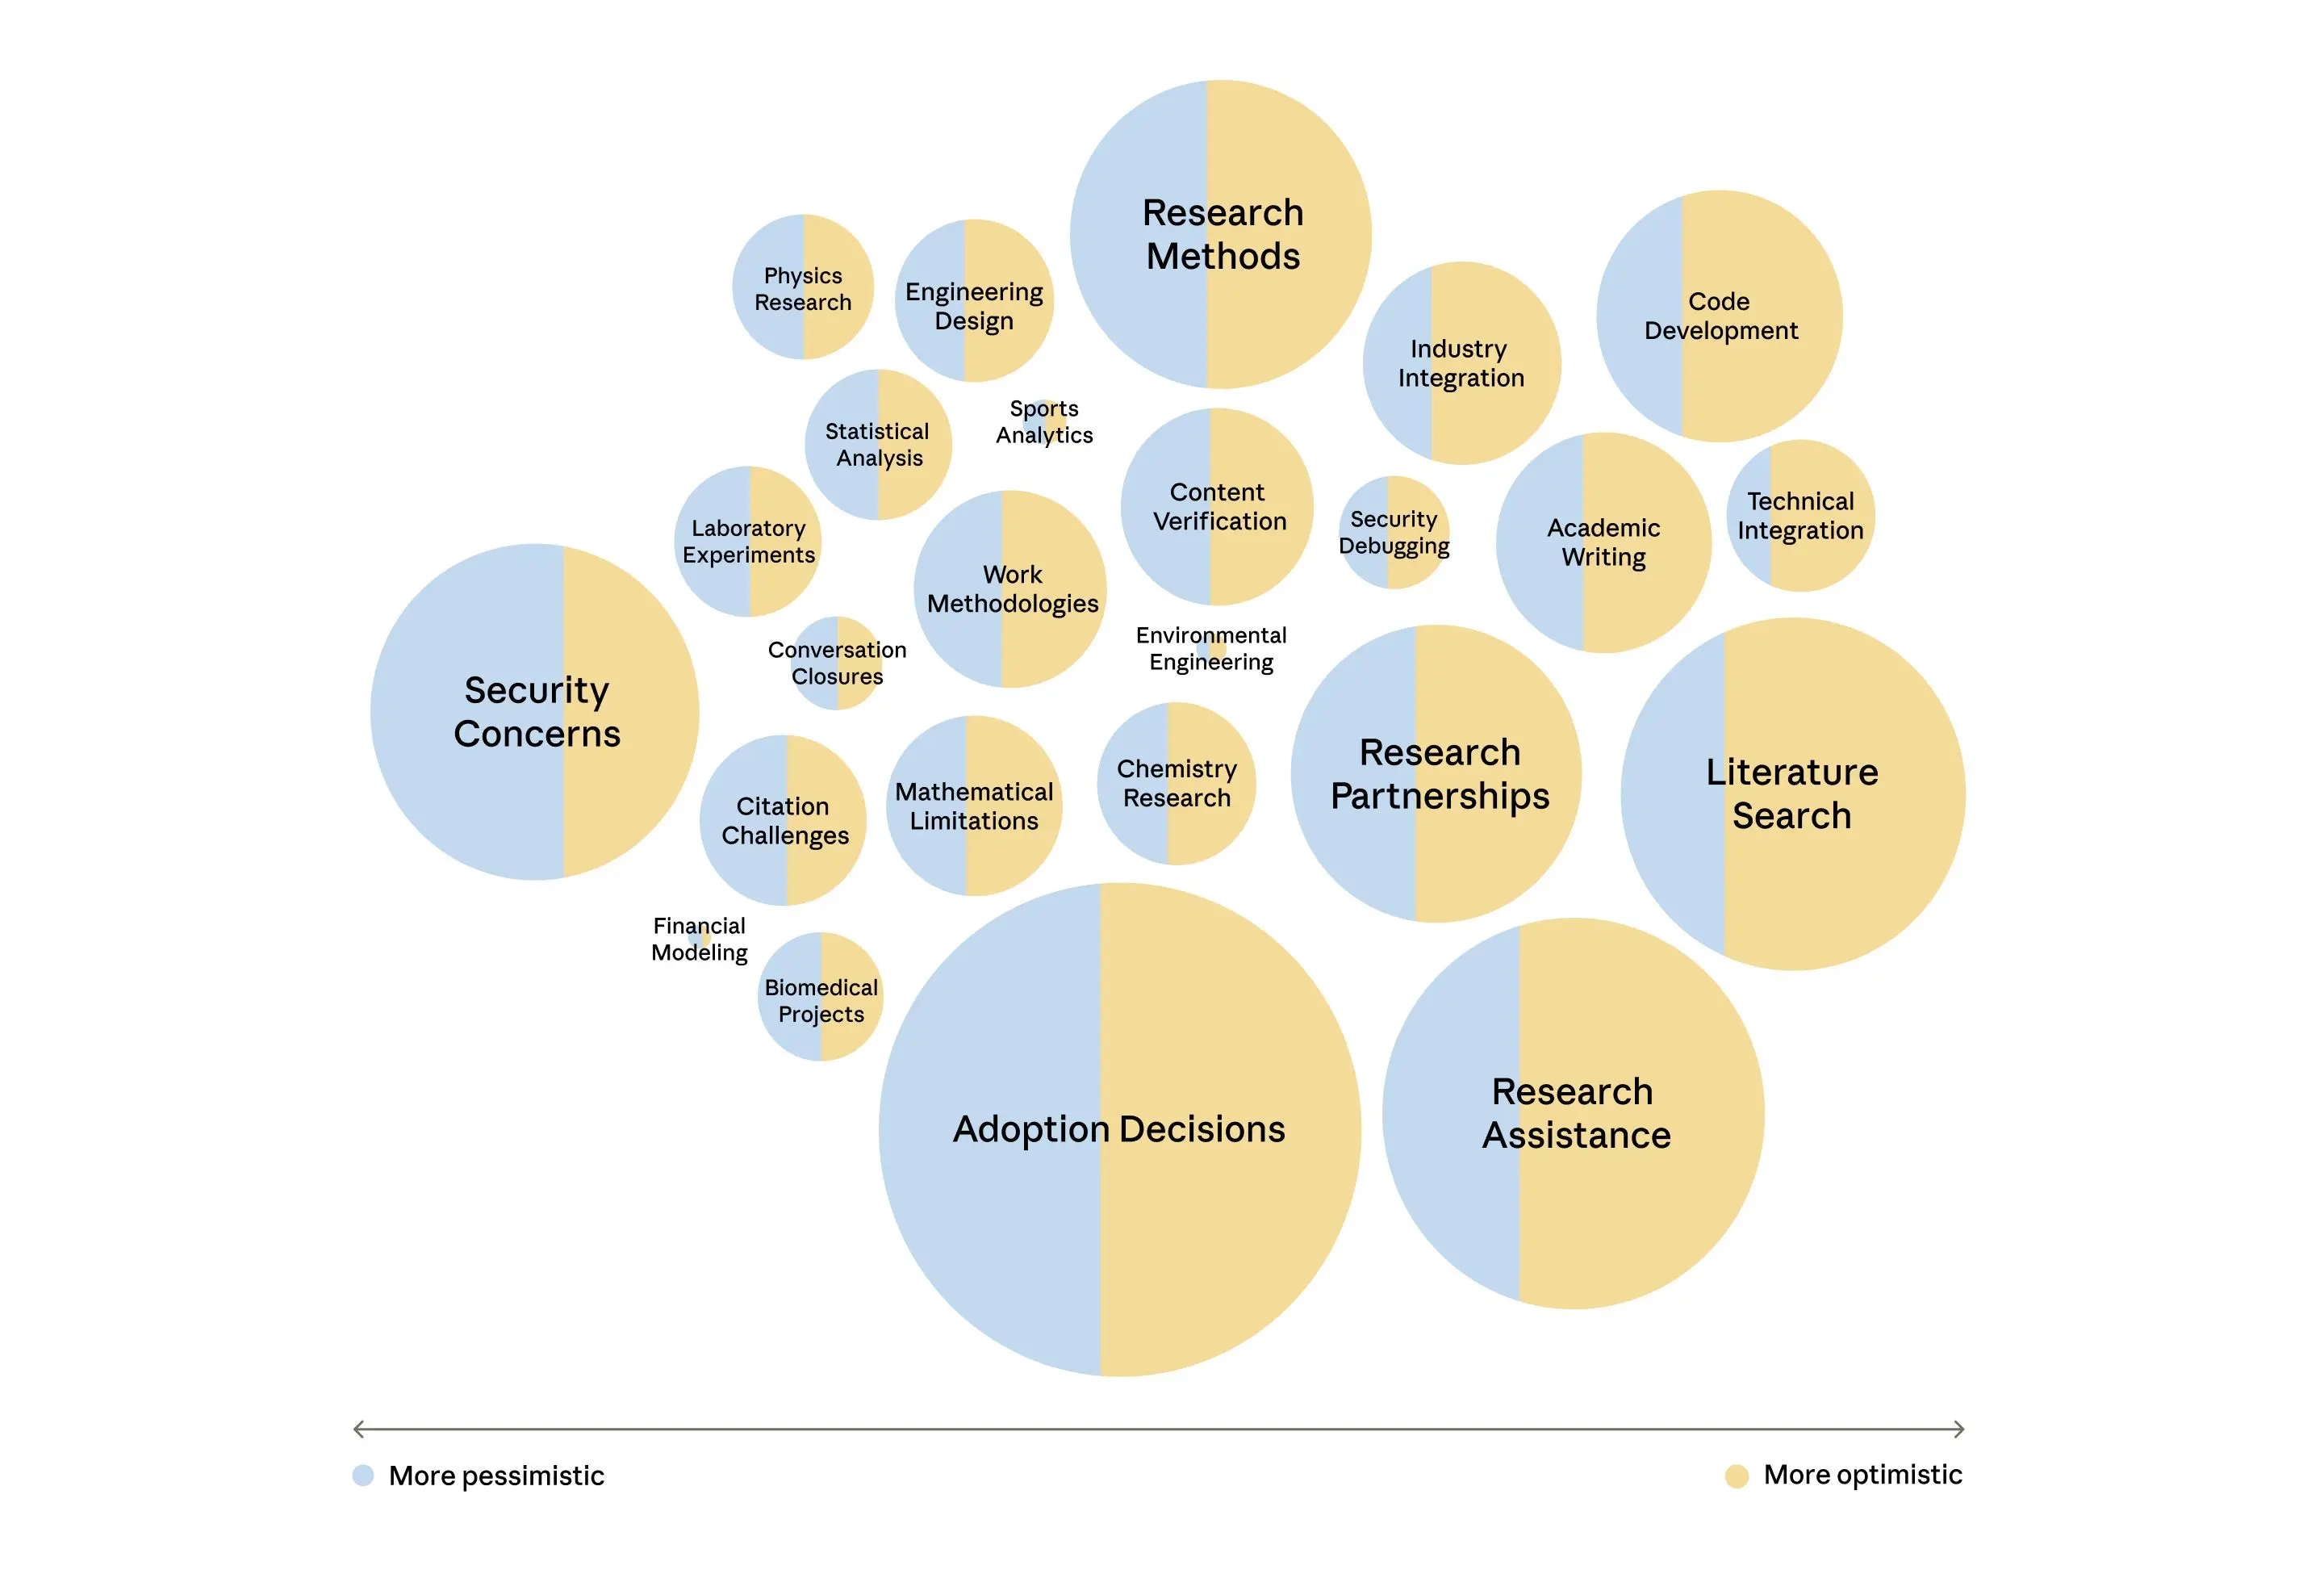
The different topics people discussed in their interviews with Anthropic Interviewer. Across all three samples we studied—the general workforce, scientists, and creatives—participants expressed predominantly positive sentiments about AI’s impact on their professional activities. Certain topics did introduce pause, particularly around questions of personal control, job displacement, and autonomy. In this diagram, topics are roughly ordered from more pessimistic to more optimistic.The different topics people discussed in their interviews with Anthropic Interviewer. Across all three samples we studied—the general workforce, scientists, and creatives—participants expressed predominantly positive sentiments about AI’s impact on their professional activities. Certain topics did introduce pause, particularly around questions of personal control, job displacement, and autonomy. In this diagram, topics are roughly ordered from more pessimistic to more optimistic.The different topics people discussed in their interviews with Anthropic Interviewer. Across all three samples we studied—the general workforce, scientists, and creatives—participants expressed predominantly positive sentiments about AI’s impact on their professional activities. Certain topics did introduce pause, particularly around questions of personal control, job displacement, and autonomy. In this diagram, topics are roughly ordered from more pessimistic to more optimistic.
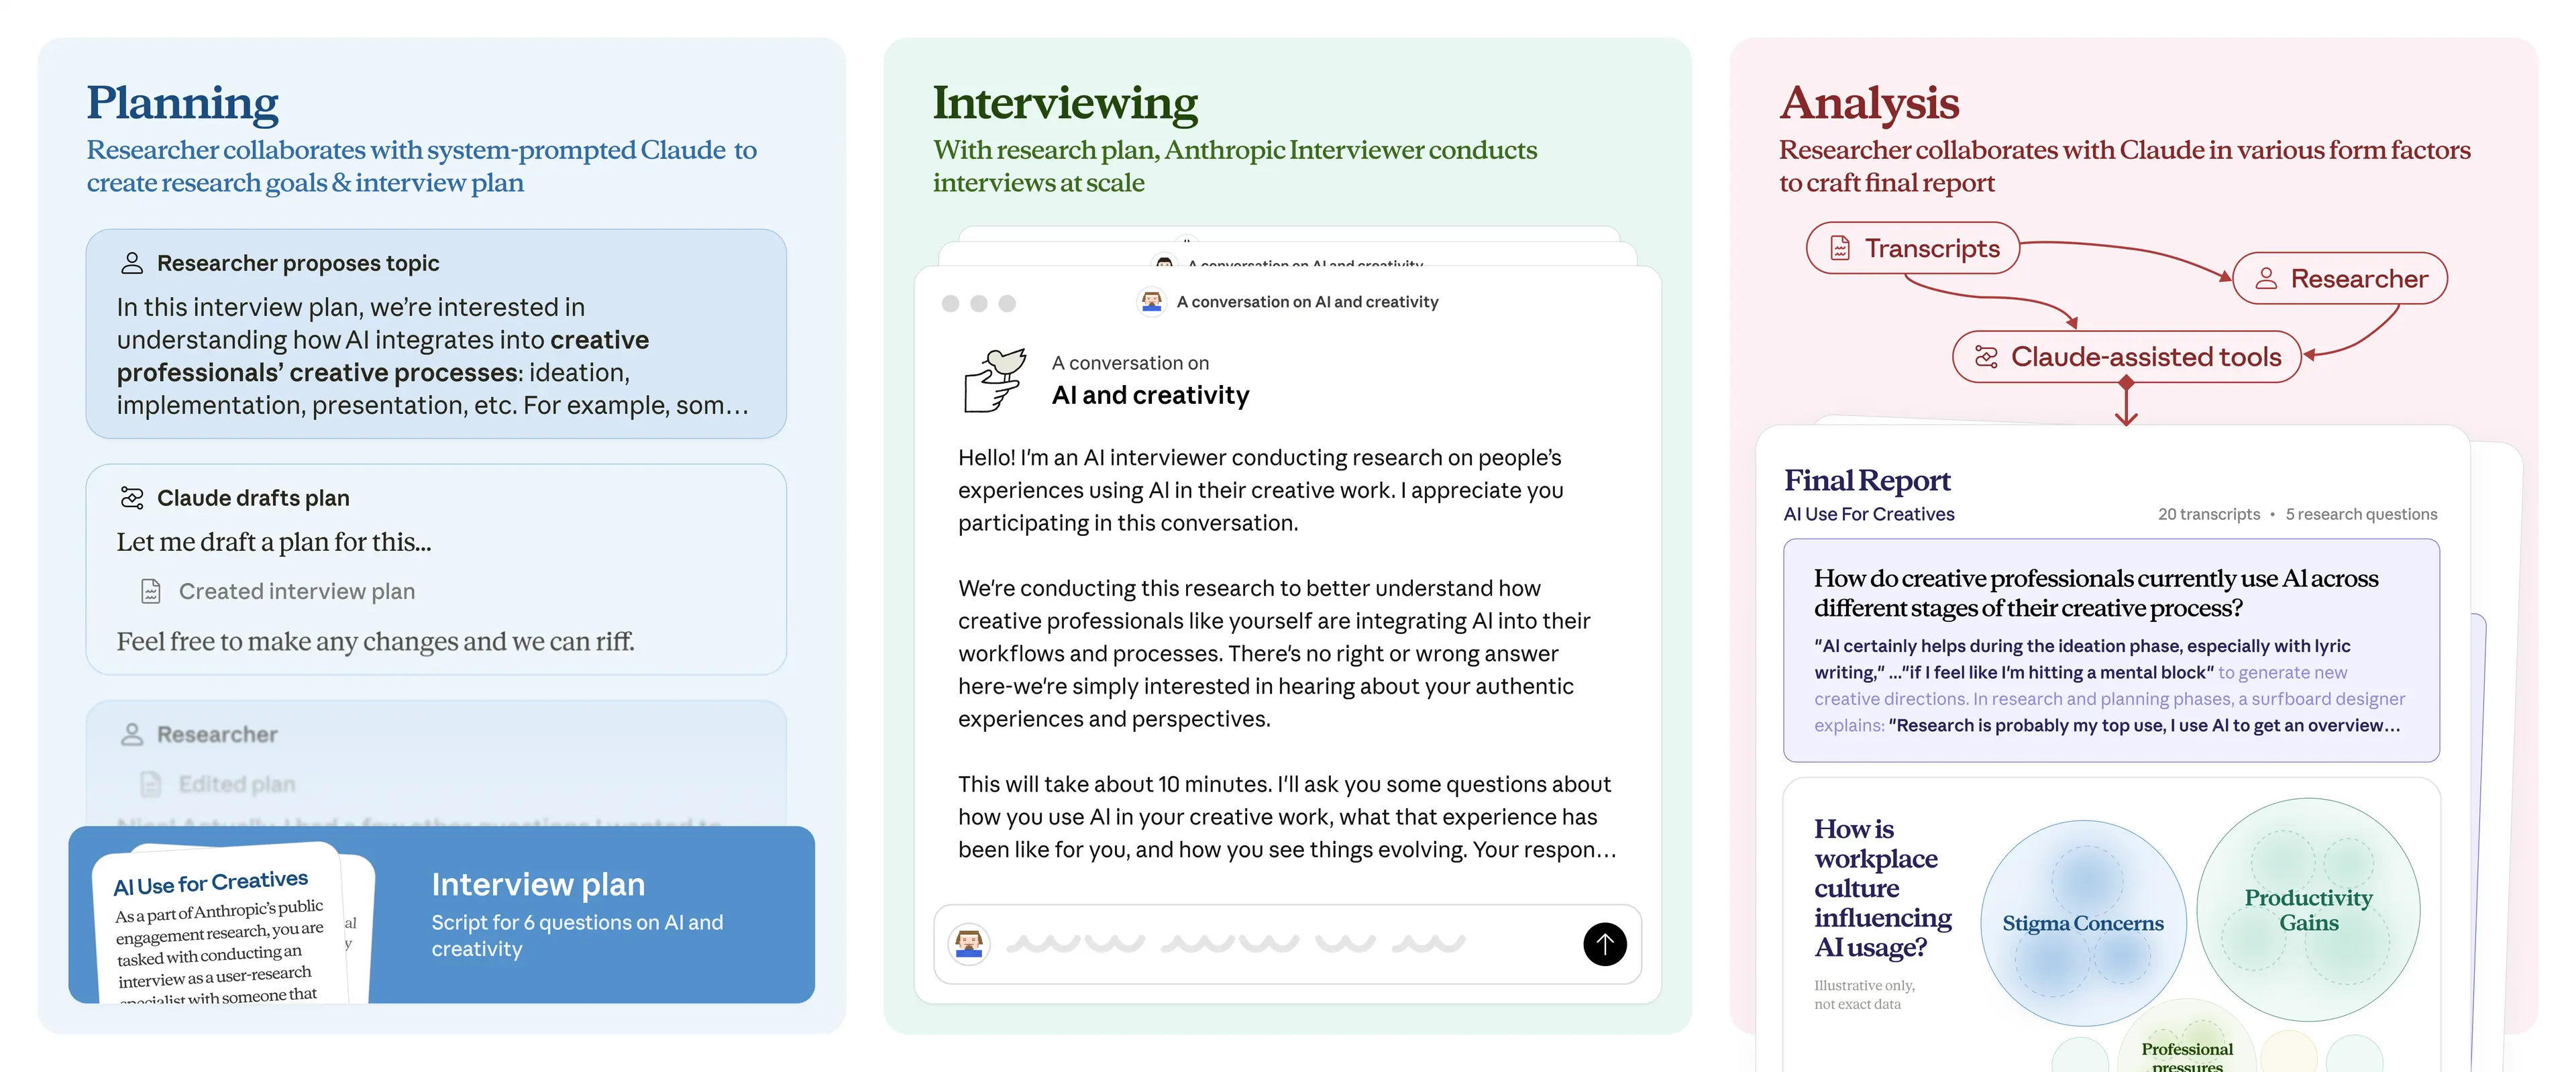
The three stages of Anthropic Interviewer's process.
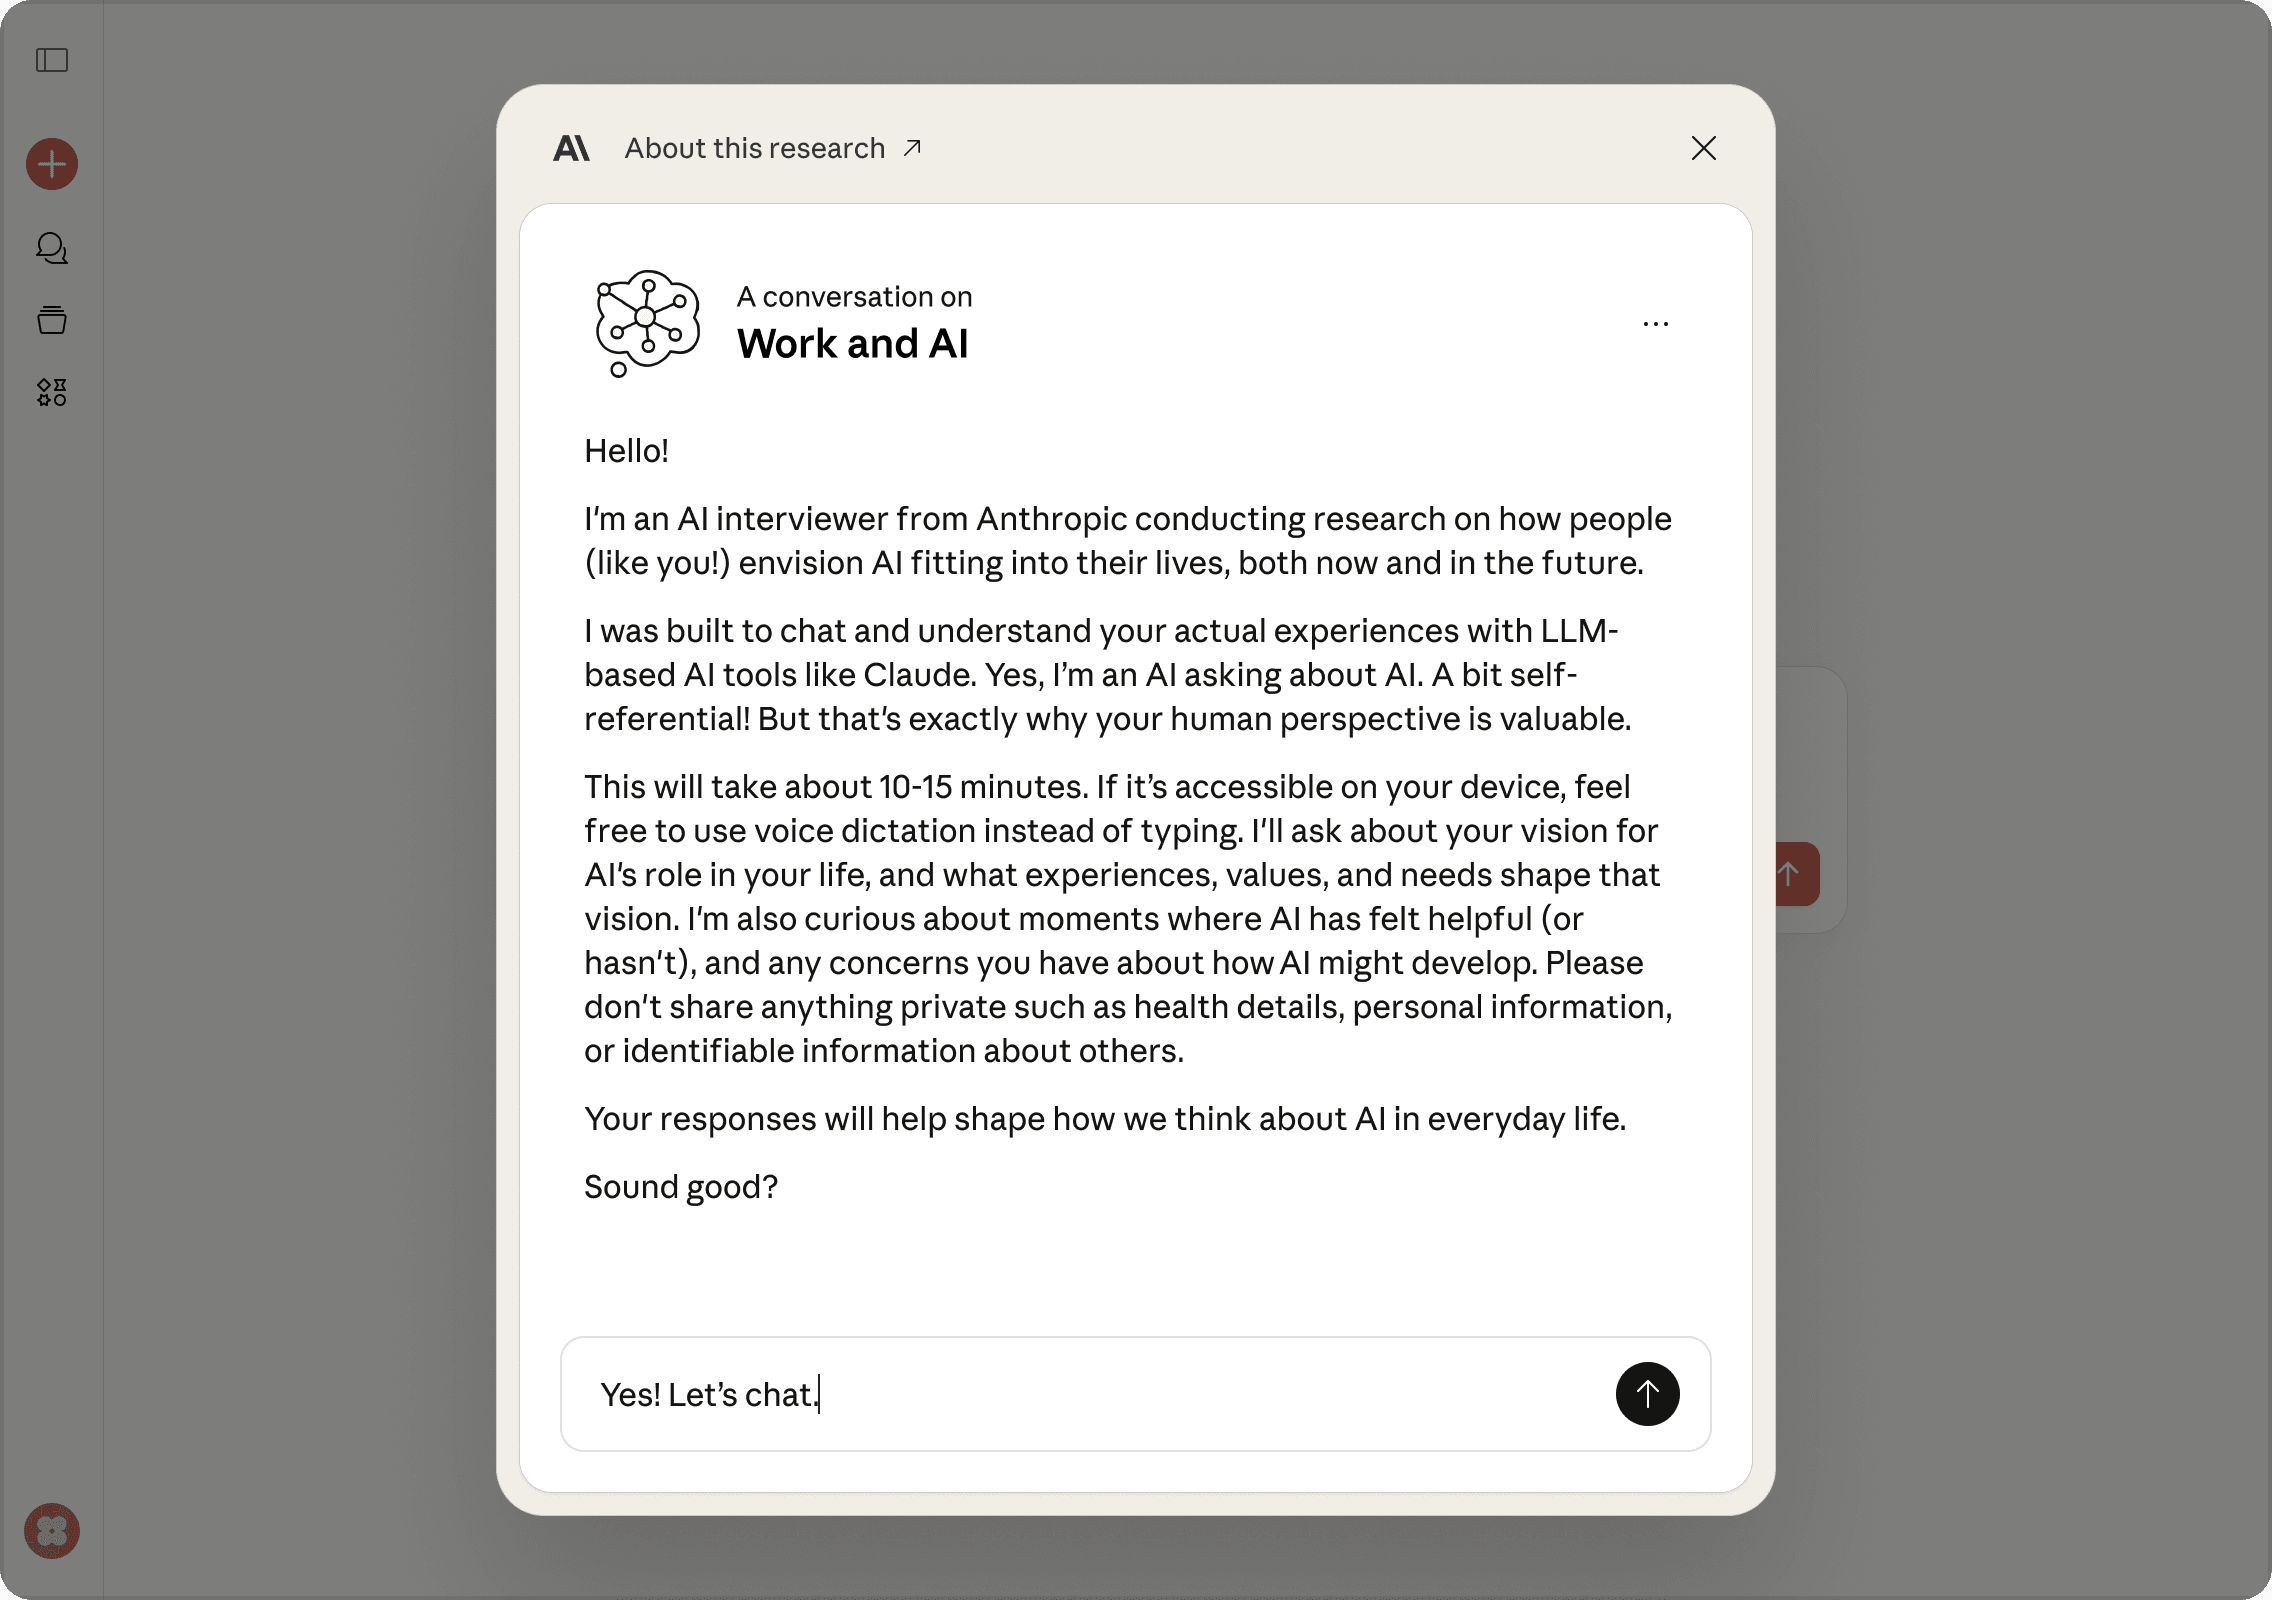
The interviews were conducted on an interface like this on claude.ai (above is the module now live for users).
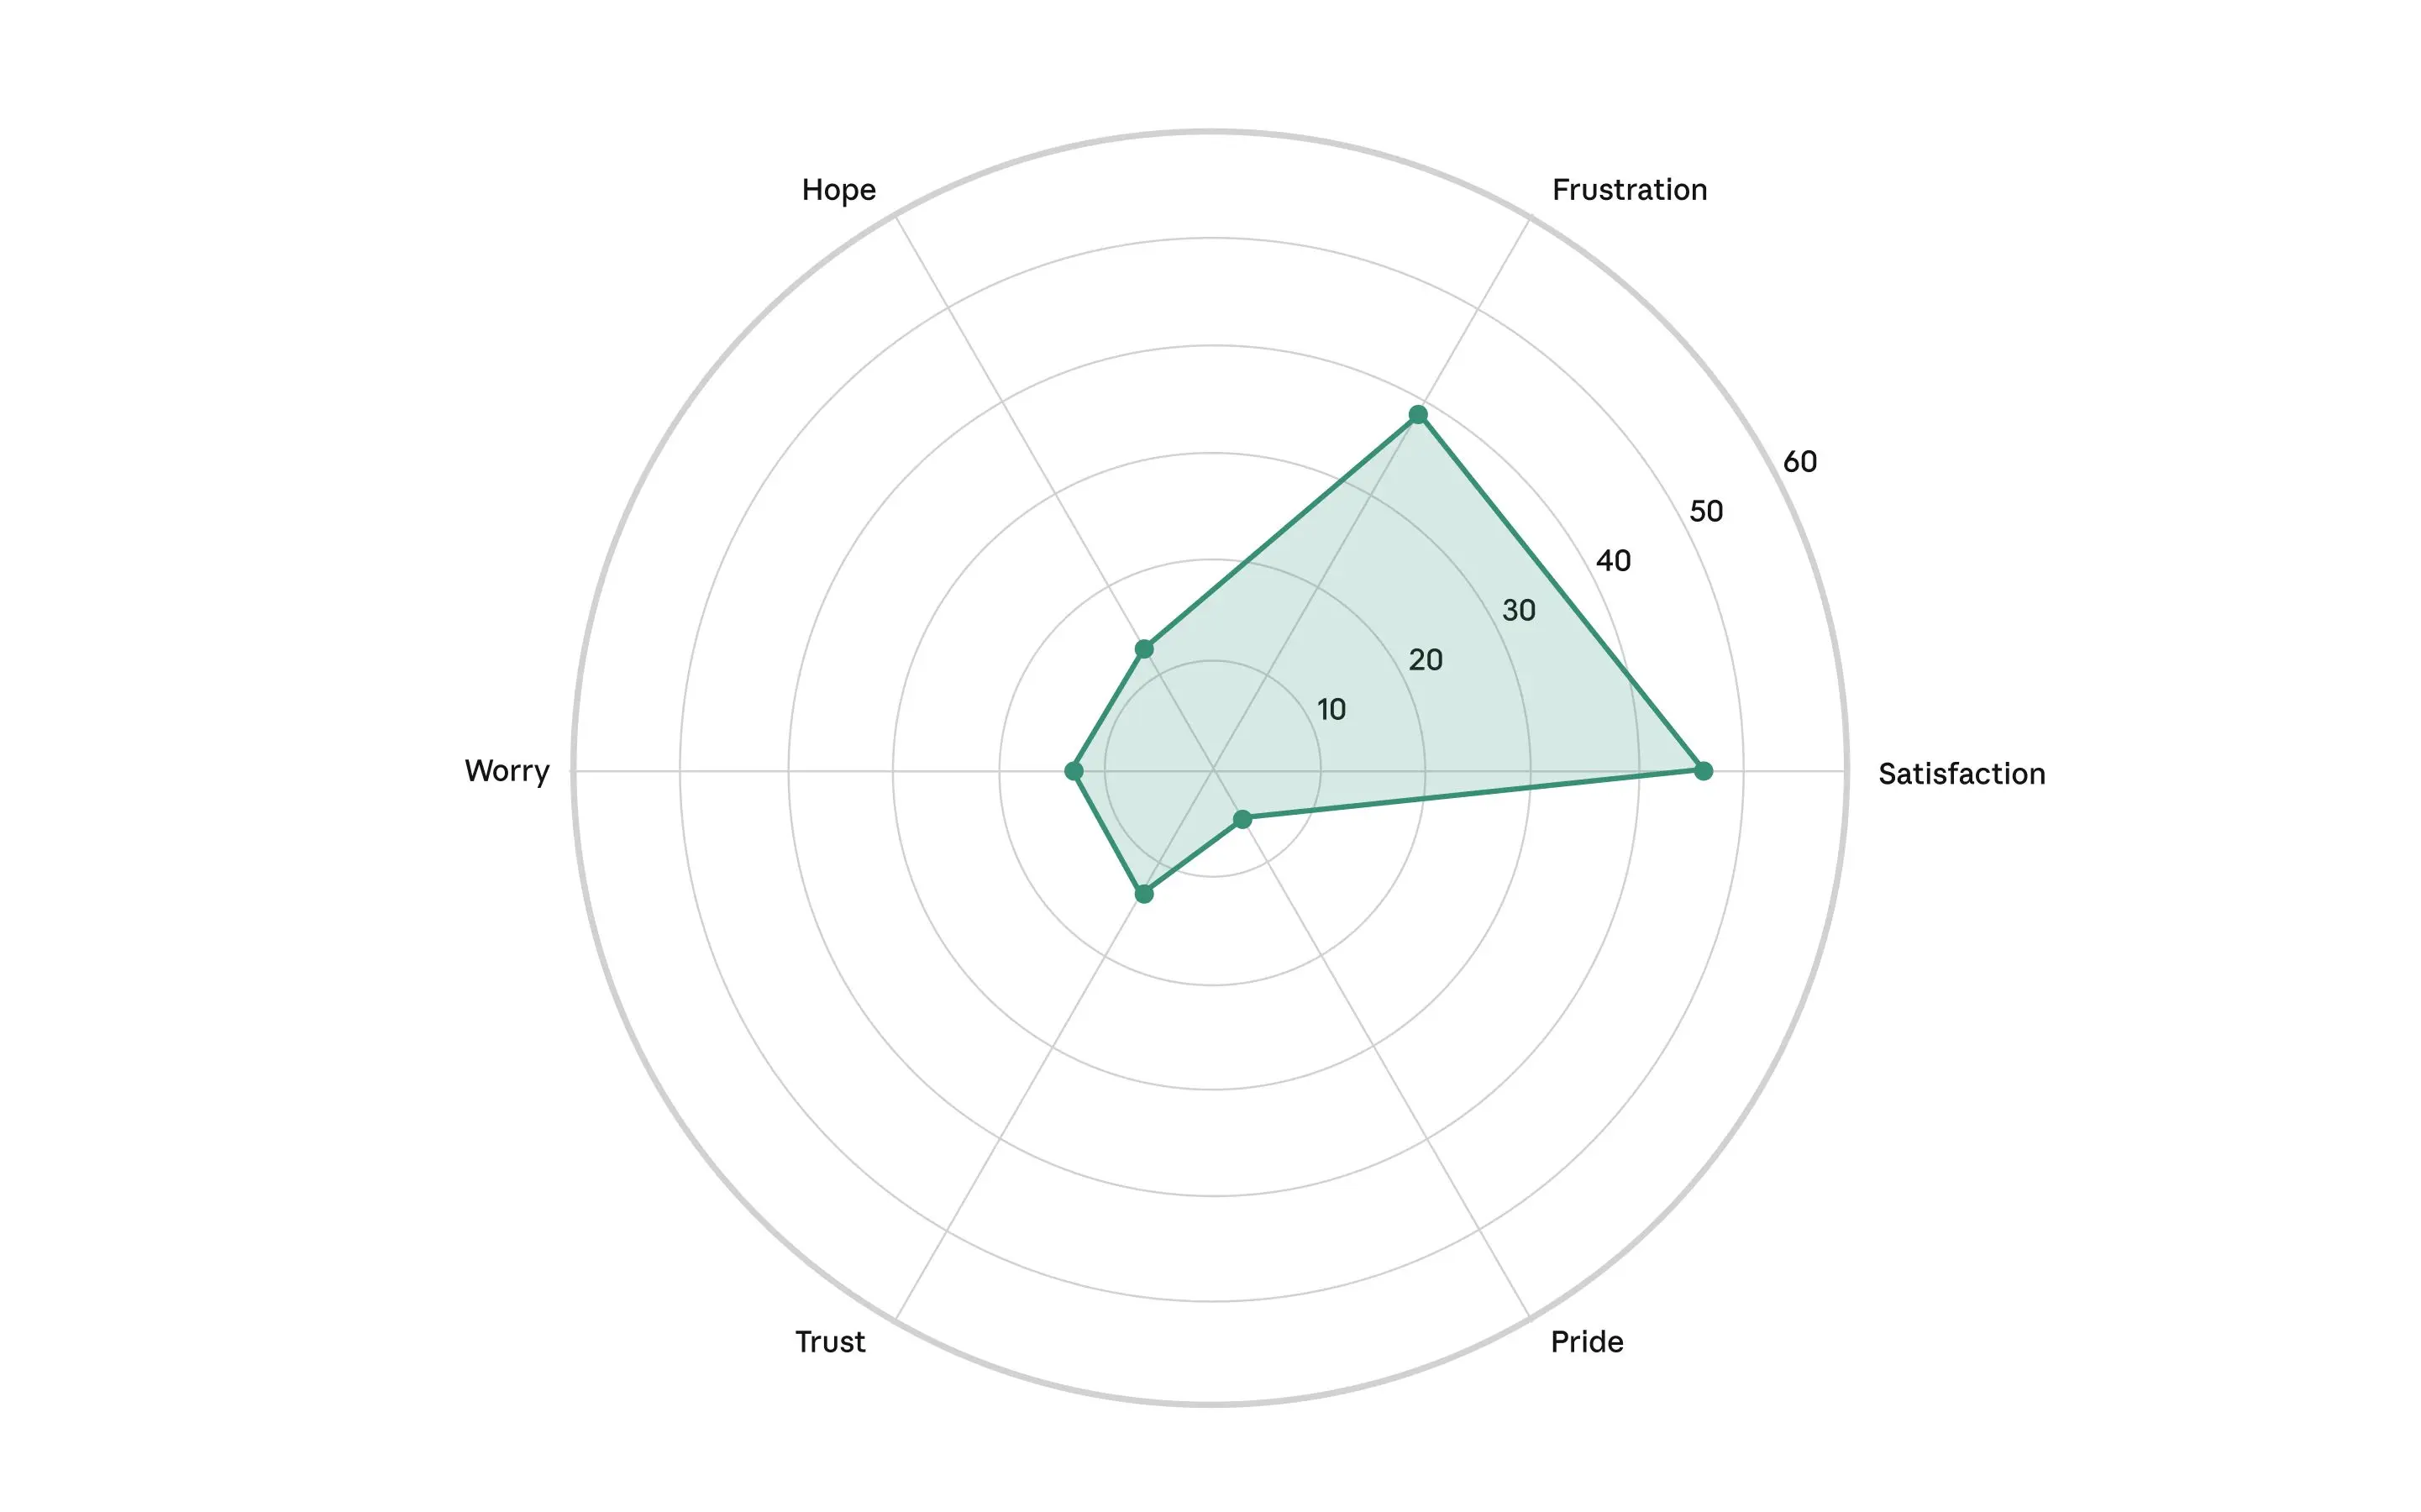
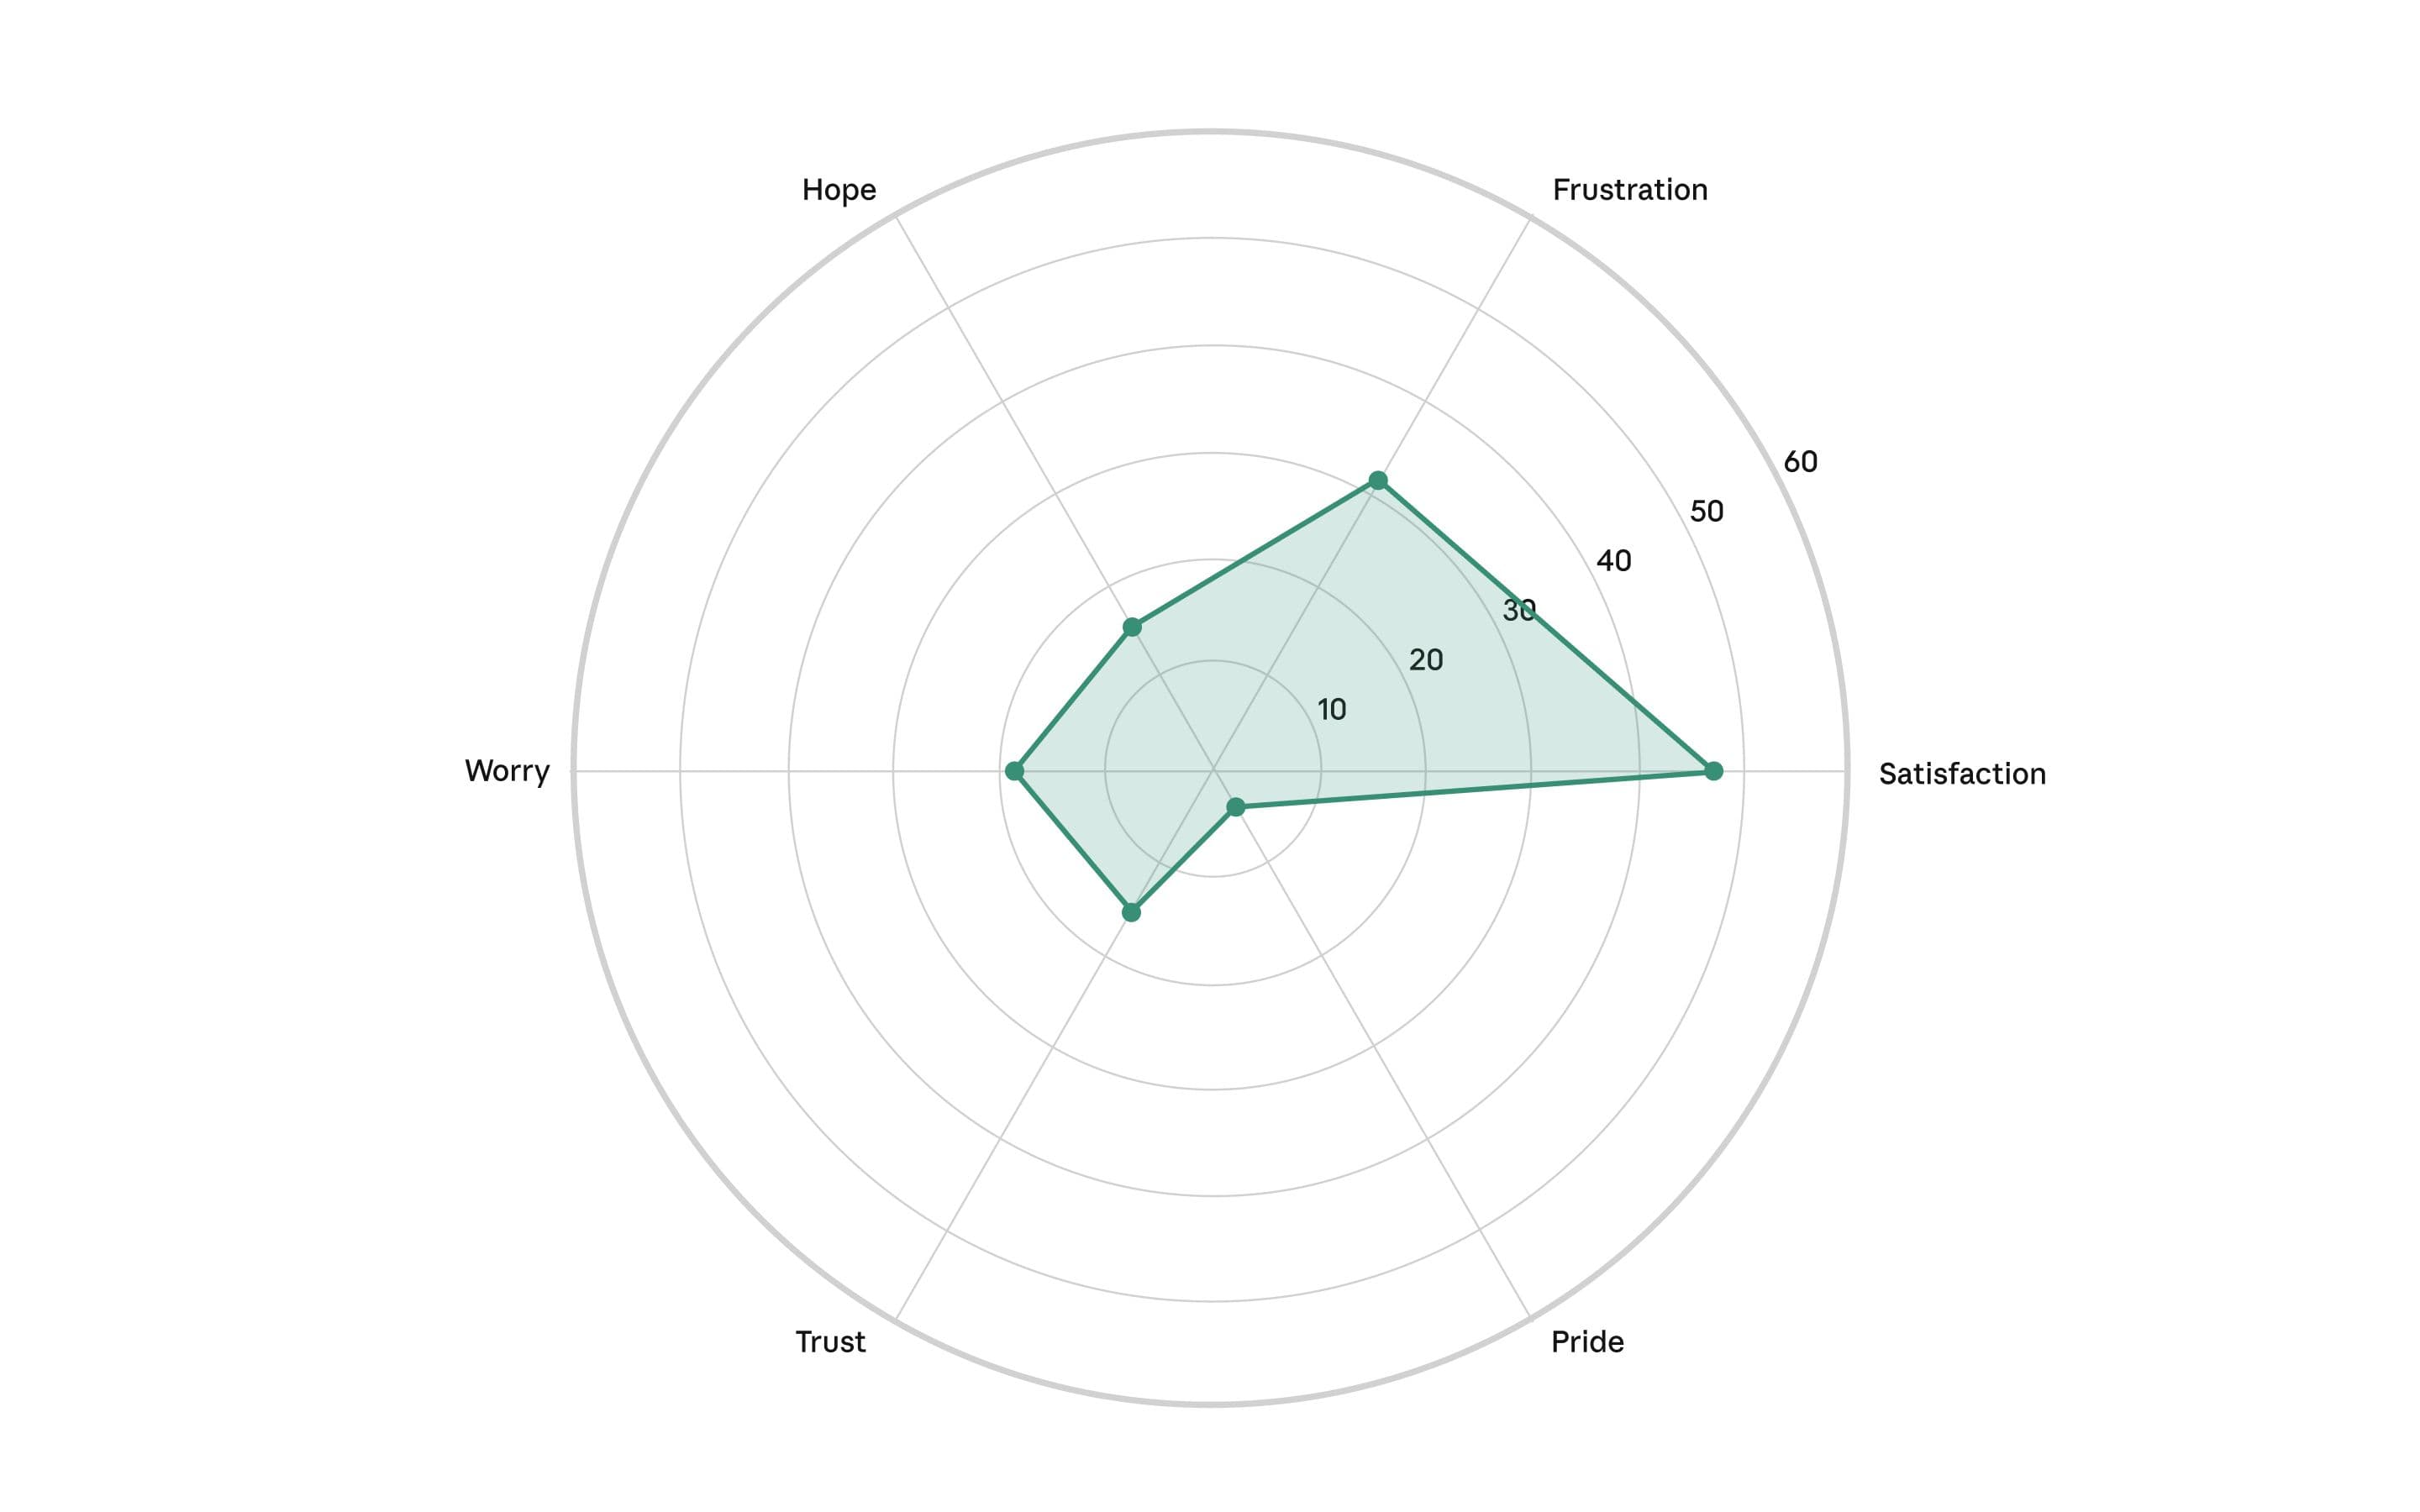
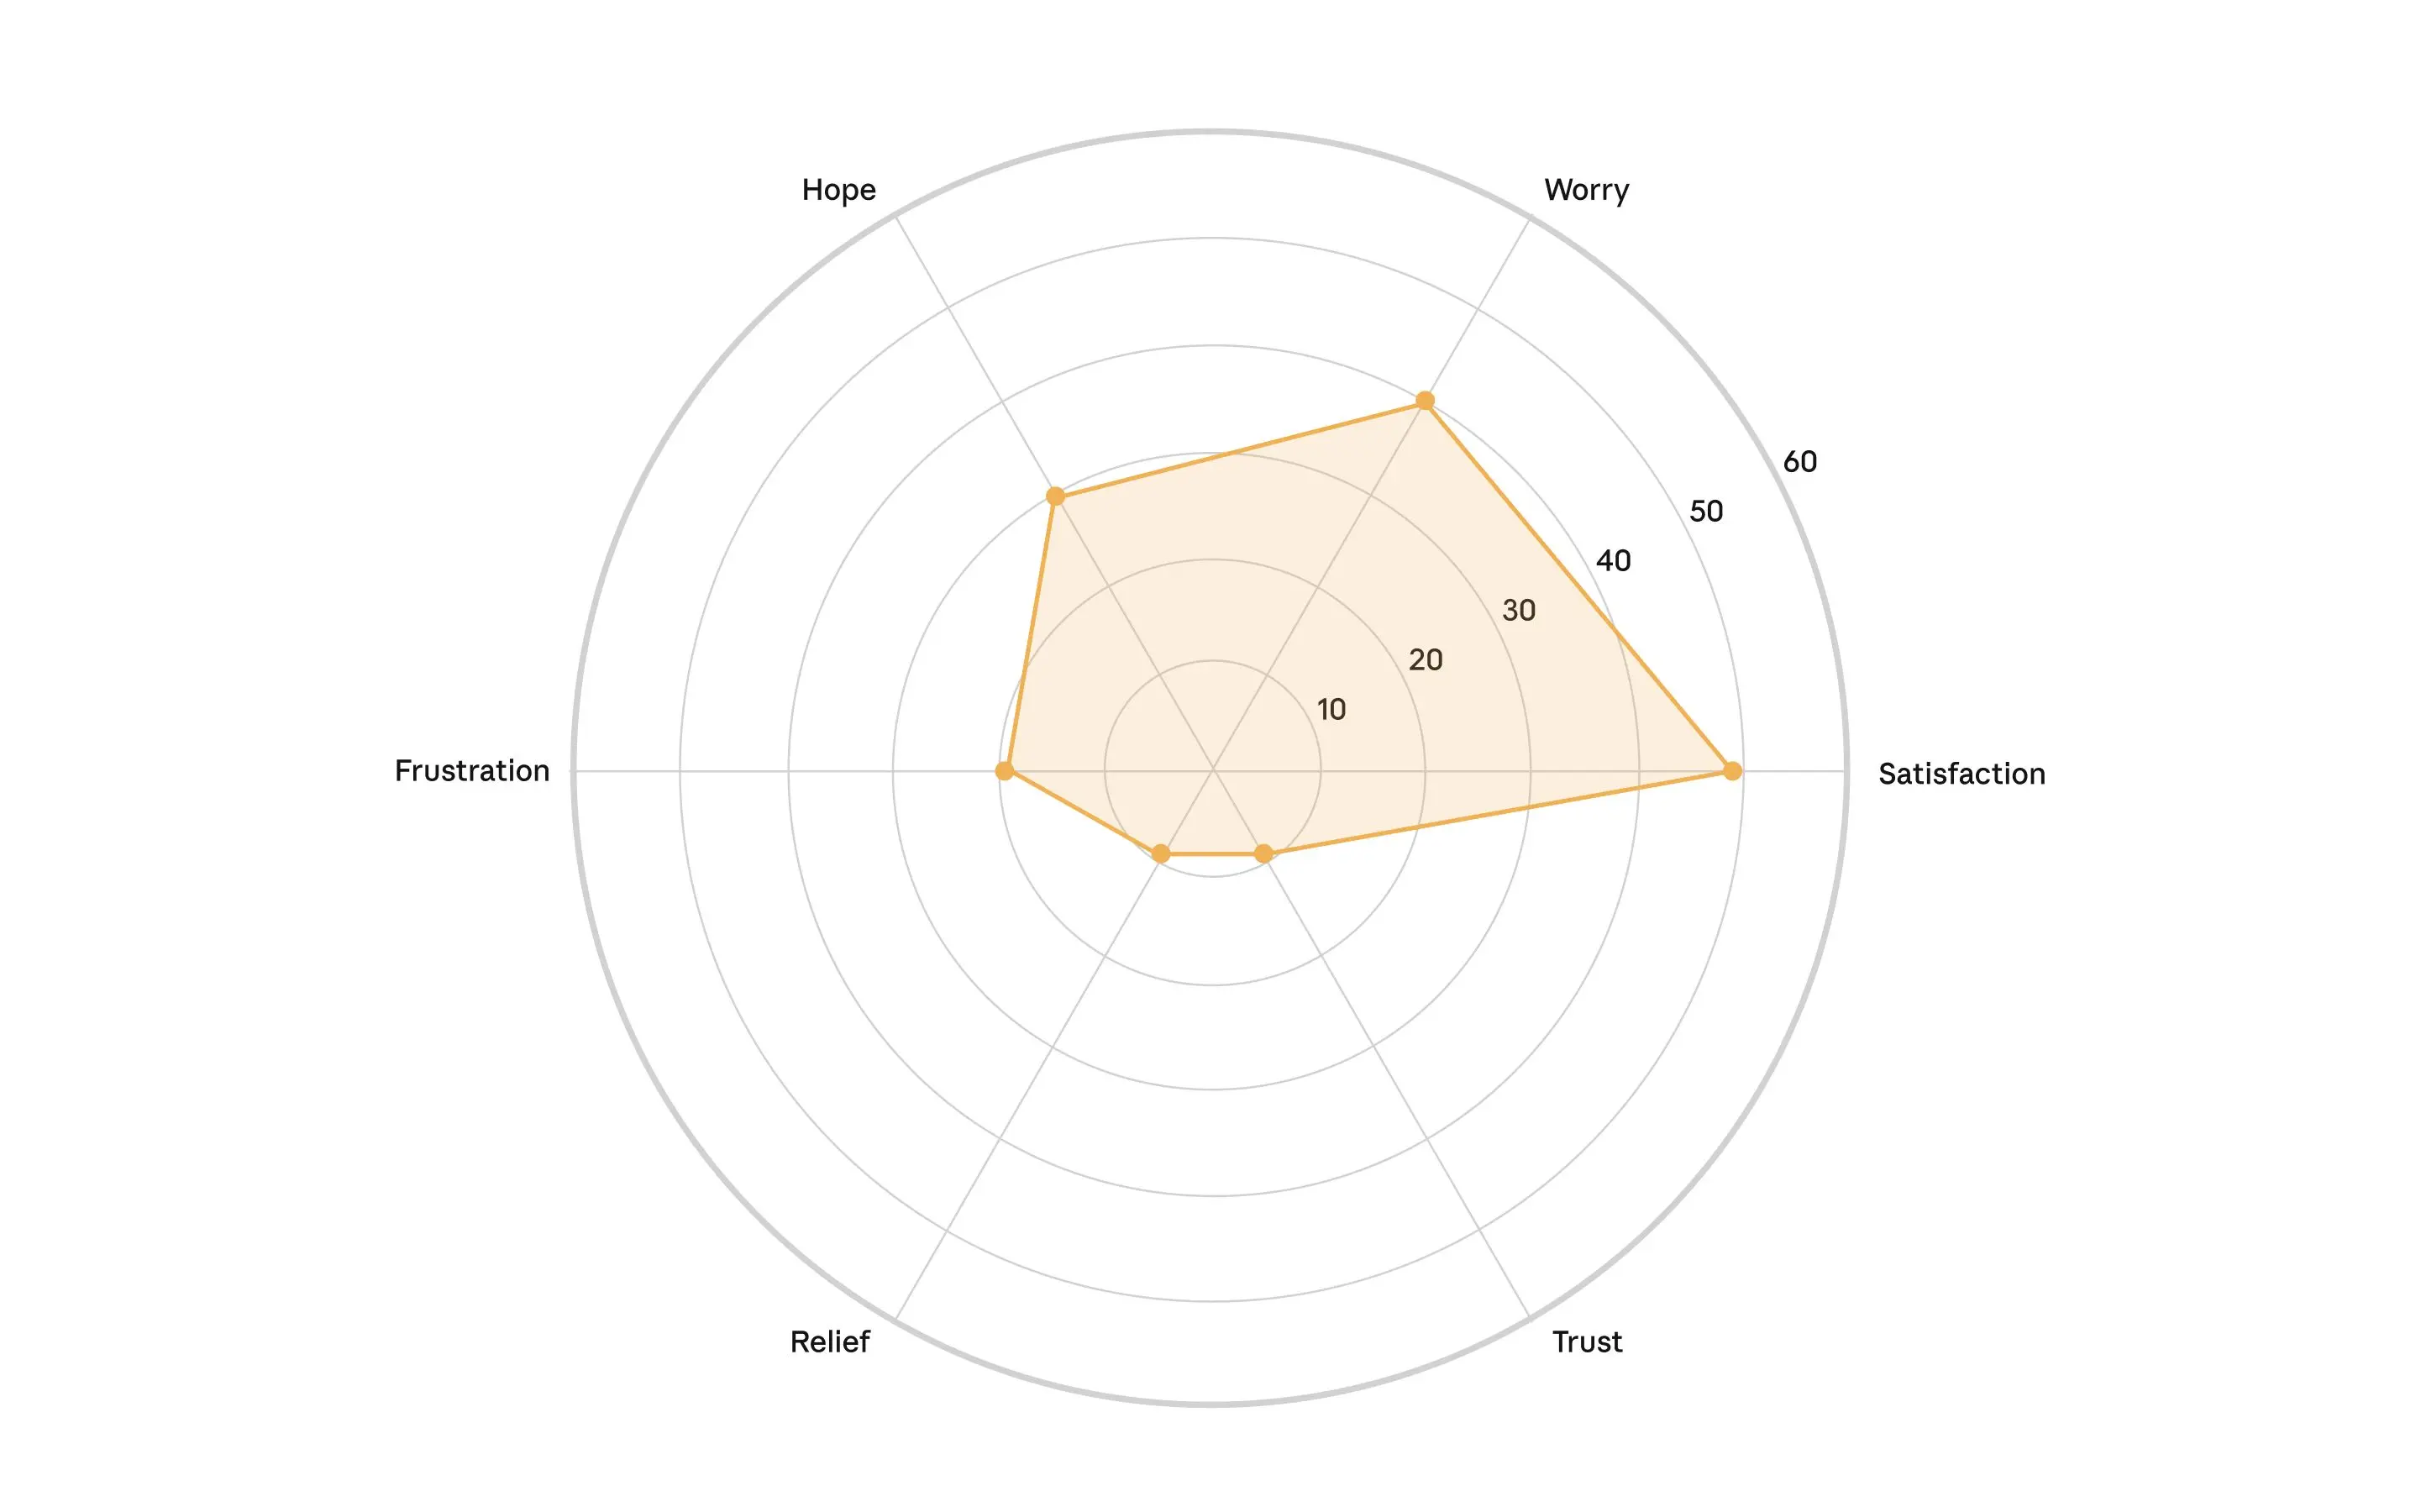
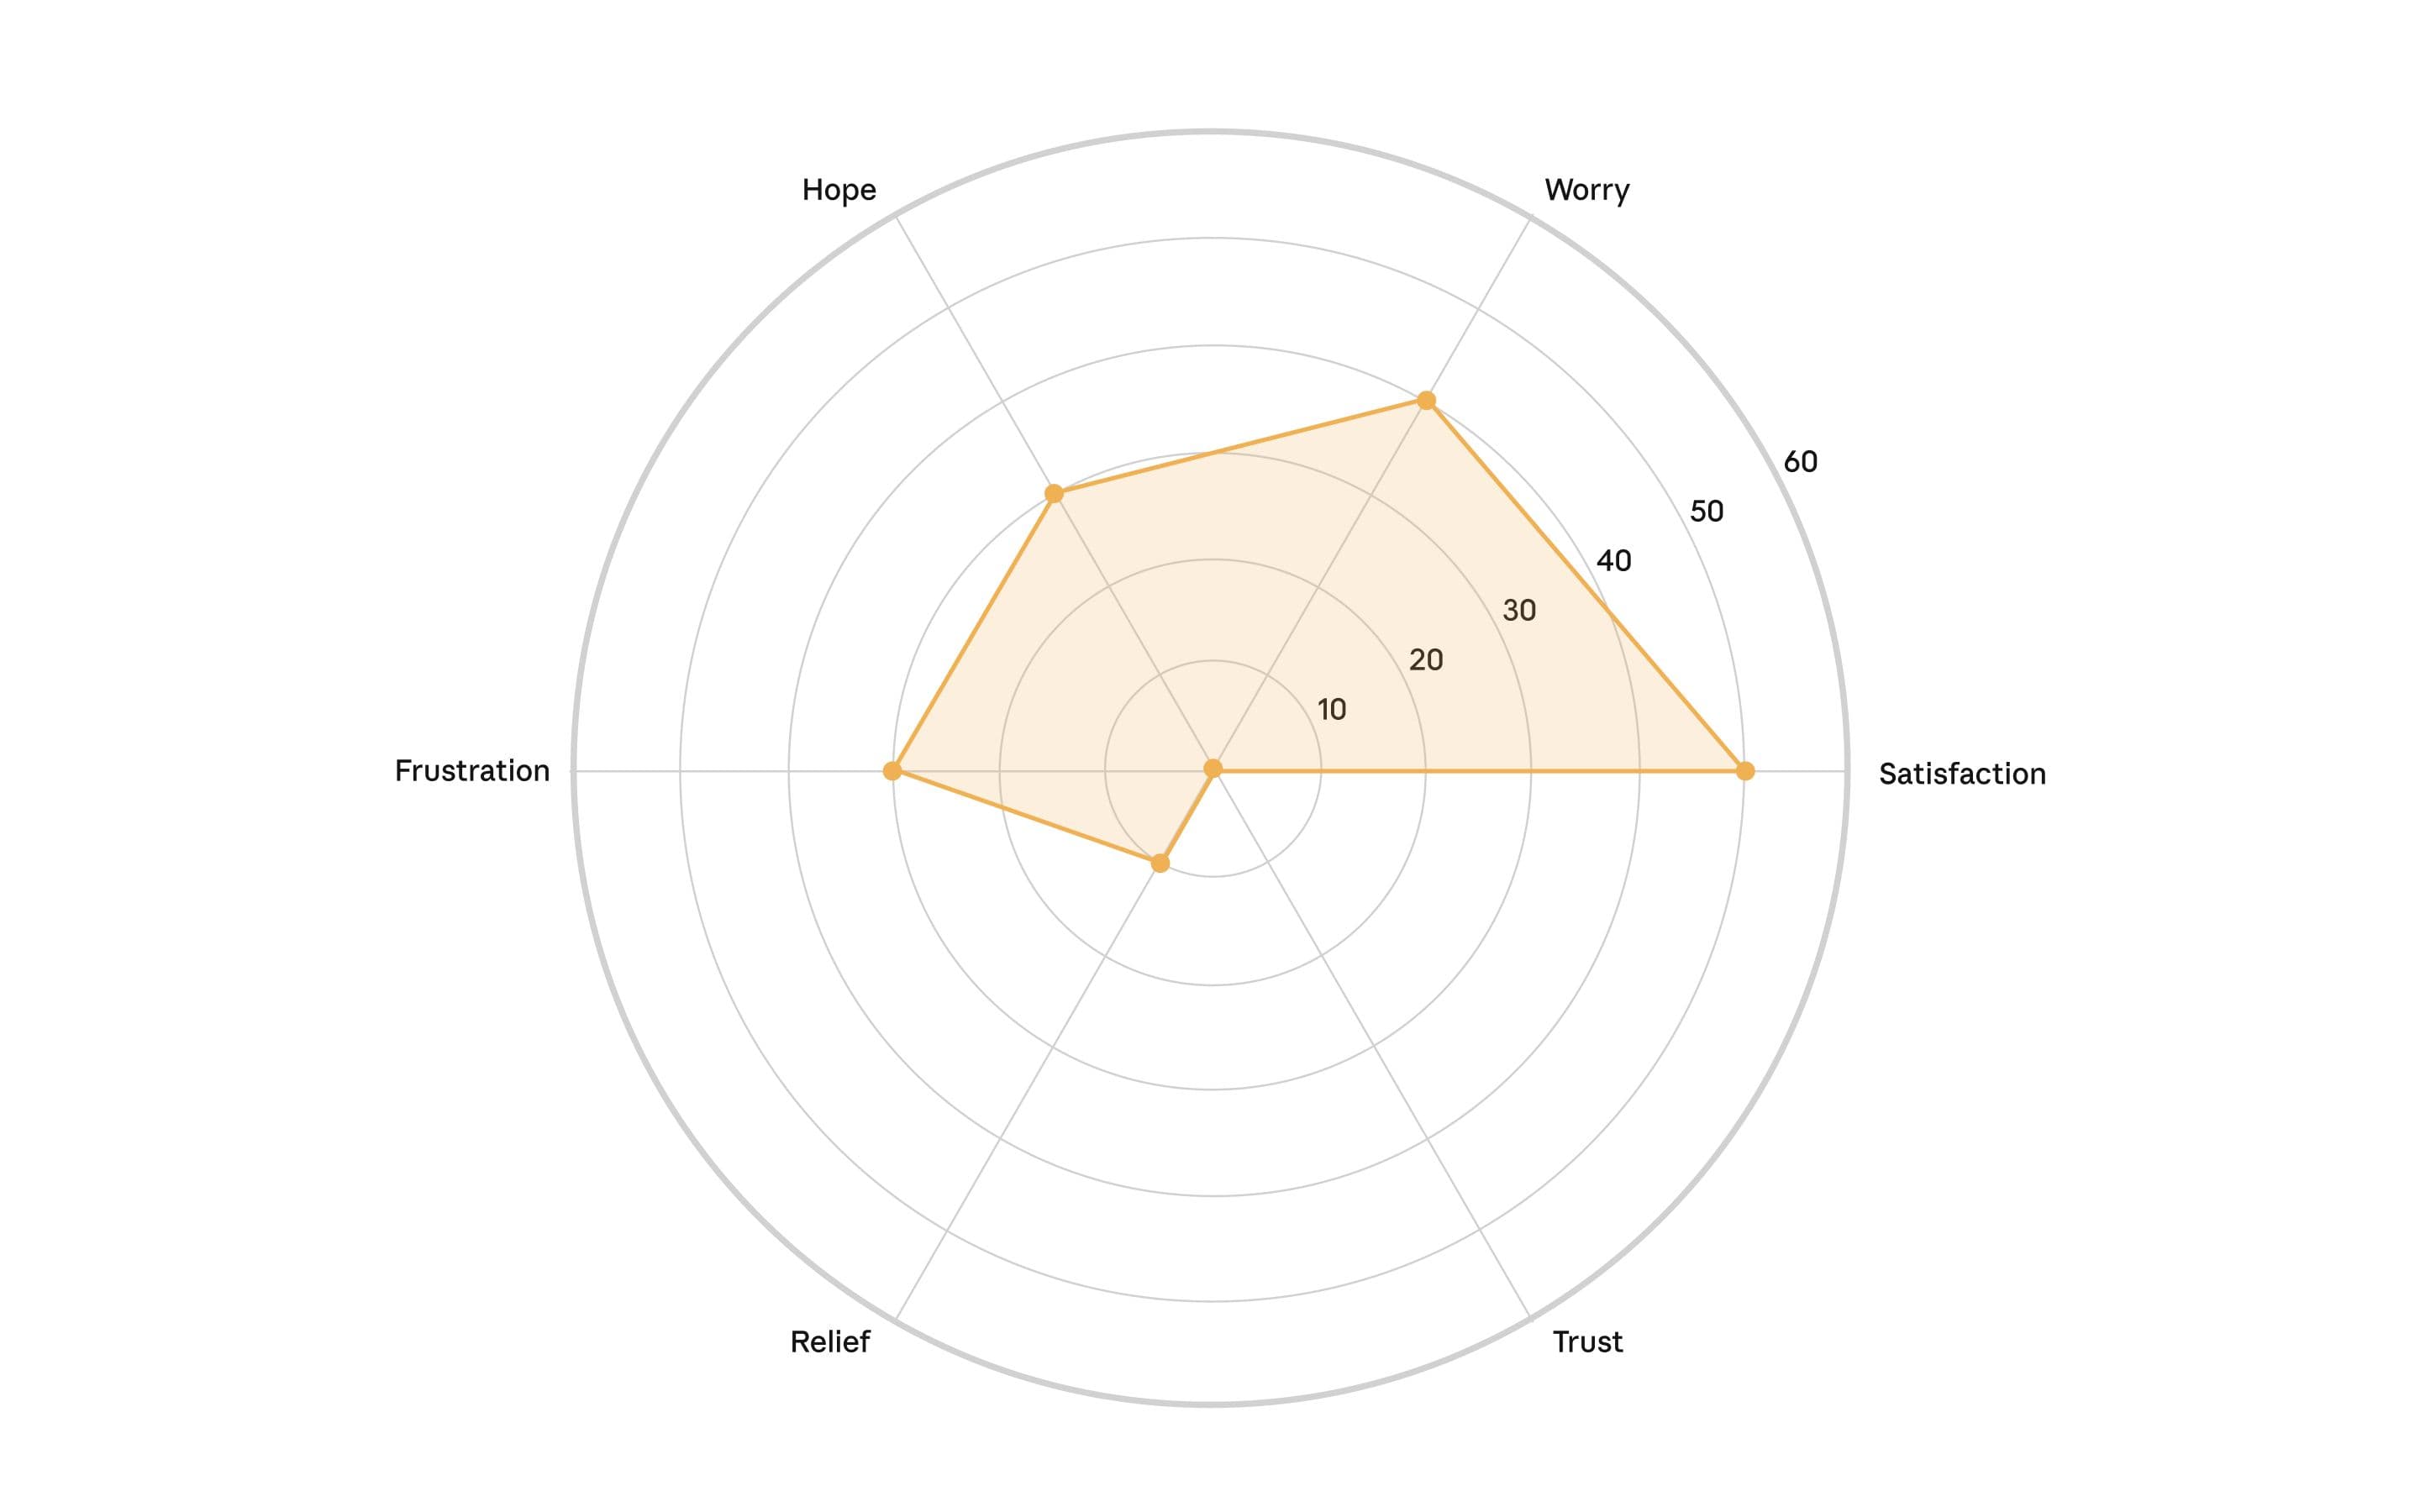
Intensity of the top six emotions—hope, worry, satisfaction, frustration, relief, and trust—surfaced during interviews with professionals in the general workforce from six major occupational categories from the O*NET database. Each axis represents one emotion, with distance from the center indicating the percentage of interviews in which participants expressed that emotion; points farther from the center reflect higher prevalence. We analyzed these emotions across the six most prominent occupational categories in our sample.Intensity of the top six emotions—hope, worry, satisfaction, frustration, relief, and trust—surfaced during interviews with professionals in the general workforce from six major occupational categories from the O*NET database. Each axis represents one emotion, with distance from the center indicating the percentage of interviews in which participants expressed that emotion; points farther from the center reflect higher prevalence. We analyzed these emotions across the six most prominent occupational categories in our sample.Intensity of the top six emotions—hope, worry, satisfaction, frustration, relief, and trust—surfaced during interviews with professionals in the general workforce from six major occupational categories from the O*NET database. Each axis represents one emotion, with distance from the center indicating the percentage of interviews in which participants expressed that emotion; points farther from the center reflect higher prevalence. We analyzed these emotions across the six most prominent occupational categories in our sample.Intensity of the top six emotions—hope, worry, satisfaction, frustration, relief, and trust—surfaced during interviews with professionals in the general workforce from six major occupational categories from the O*NET database. Each axis represents one emotion, with distance from the center indicating the percentage of interviews in which participants expressed that emotion; points farther from the center reflect higher prevalence. We analyzed these emotions across the six most prominent occupational categories in our sample.Intensity of the top six emotions—hope, worry, satisfaction, frustration, relief, and trust—surfaced during interviews with professionals in the general workforce from six major occupational categories from the O*NET database. Each axis represents one emotion, with distance from the center indicating the percentage of interviews in which participants expressed that emotion; points farther from the center reflect higher prevalence. We analyzed these emotions across the six most prominent occupational categories in our sample.Intensity of the top six emotions—hope, worry, satisfaction, frustration, relief, and trust—surfaced during interviews with professionals in the general workforce from six major occupational categories from the O*NET database. Each axis represents one emotion, with distance from the center indicating the percentage of interviews in which participants expressed that emotion; points farther from the center reflect higher prevalence. We analyzed these emotions across the six most prominent occupational categories in our sample.
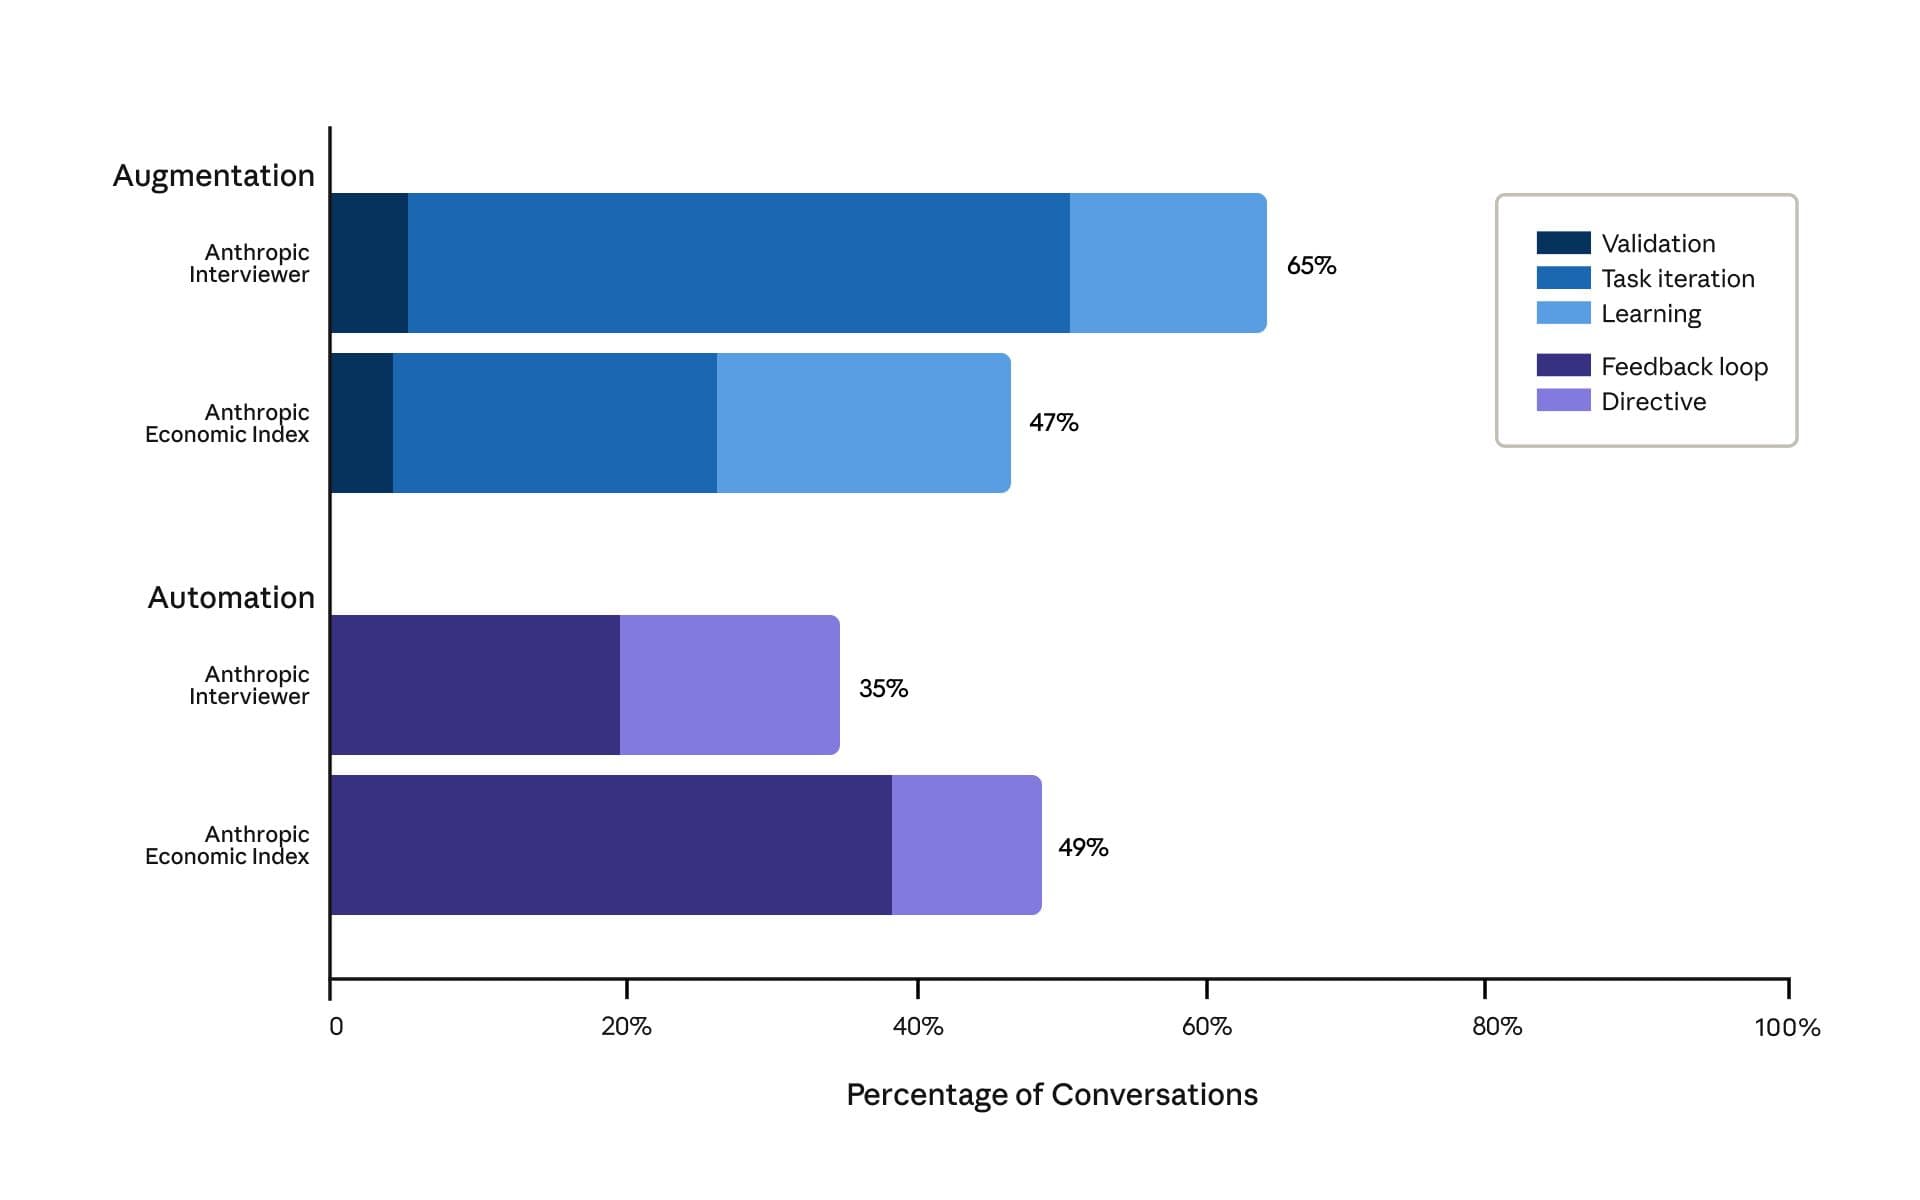
Augmentation versus automation in professionals' self-reports to Anthropic Interviewer compared with observed Claude usage in the Anthropic Economic Index. Professionals described their AI use as 65% augmentative and 35% automative, while actual Claude conversations showed 47% augmentation and 49% automation. Economic Index percentages do not sum to 100% as some interactions were unclassified.
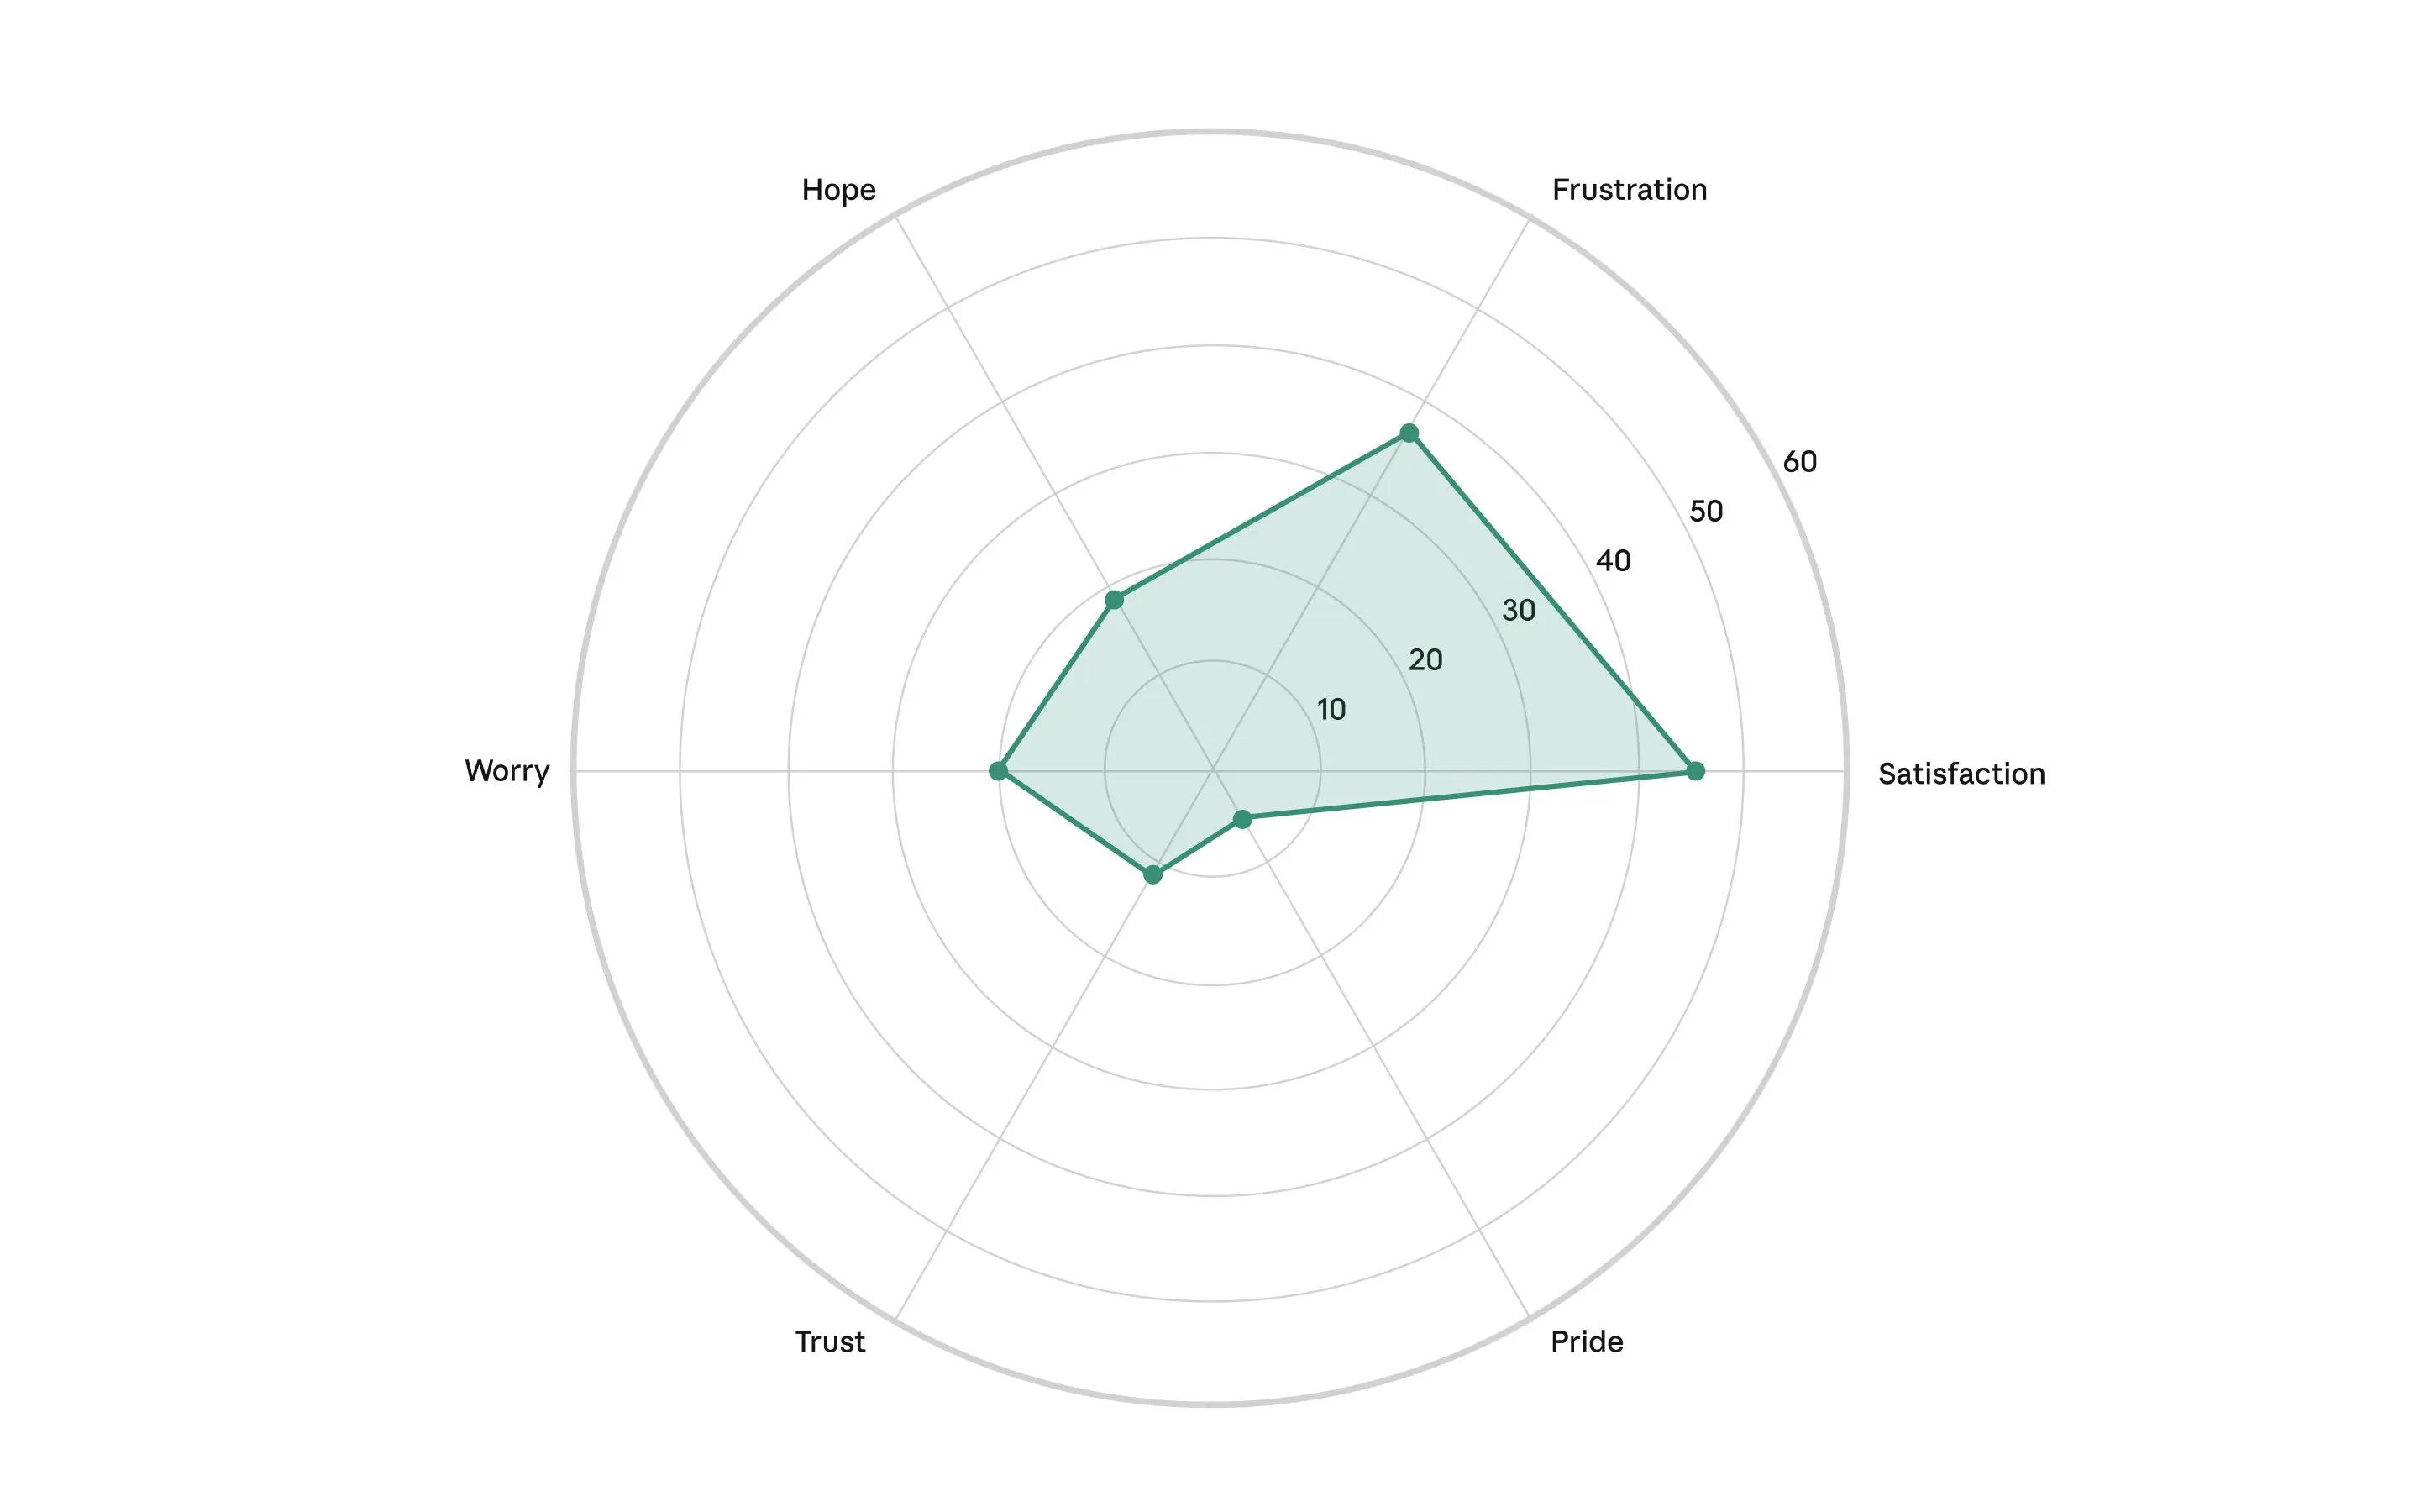
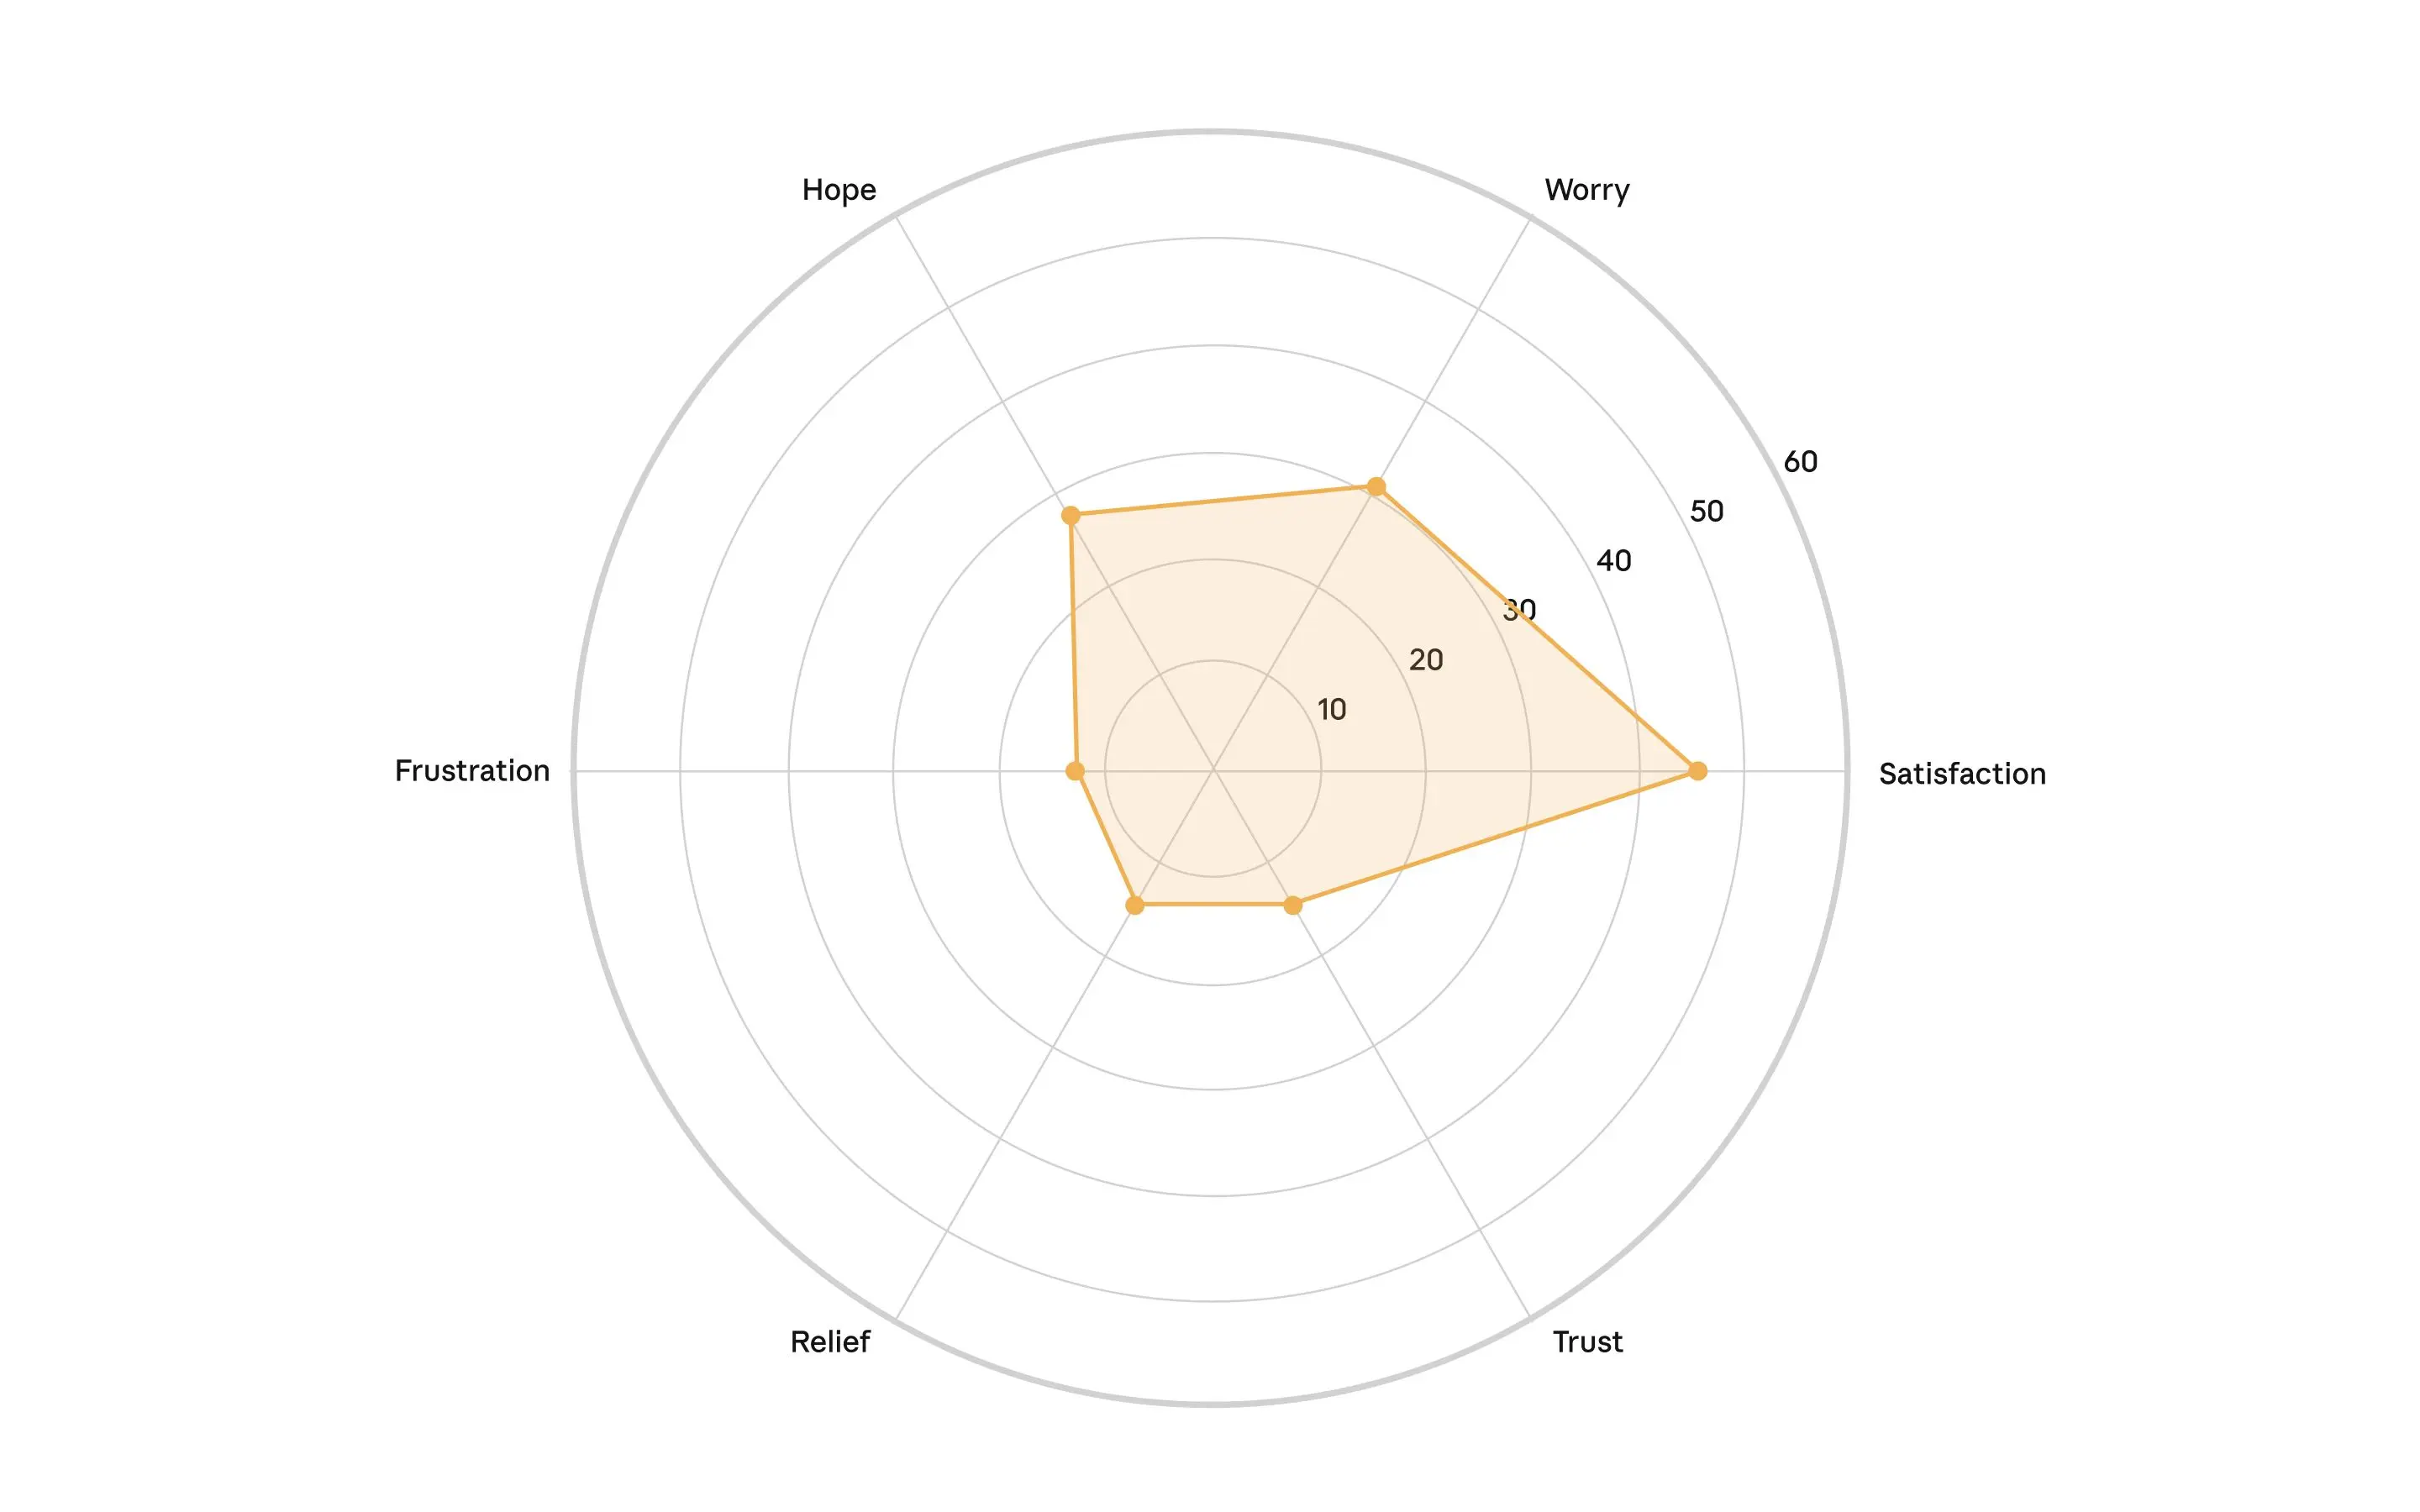
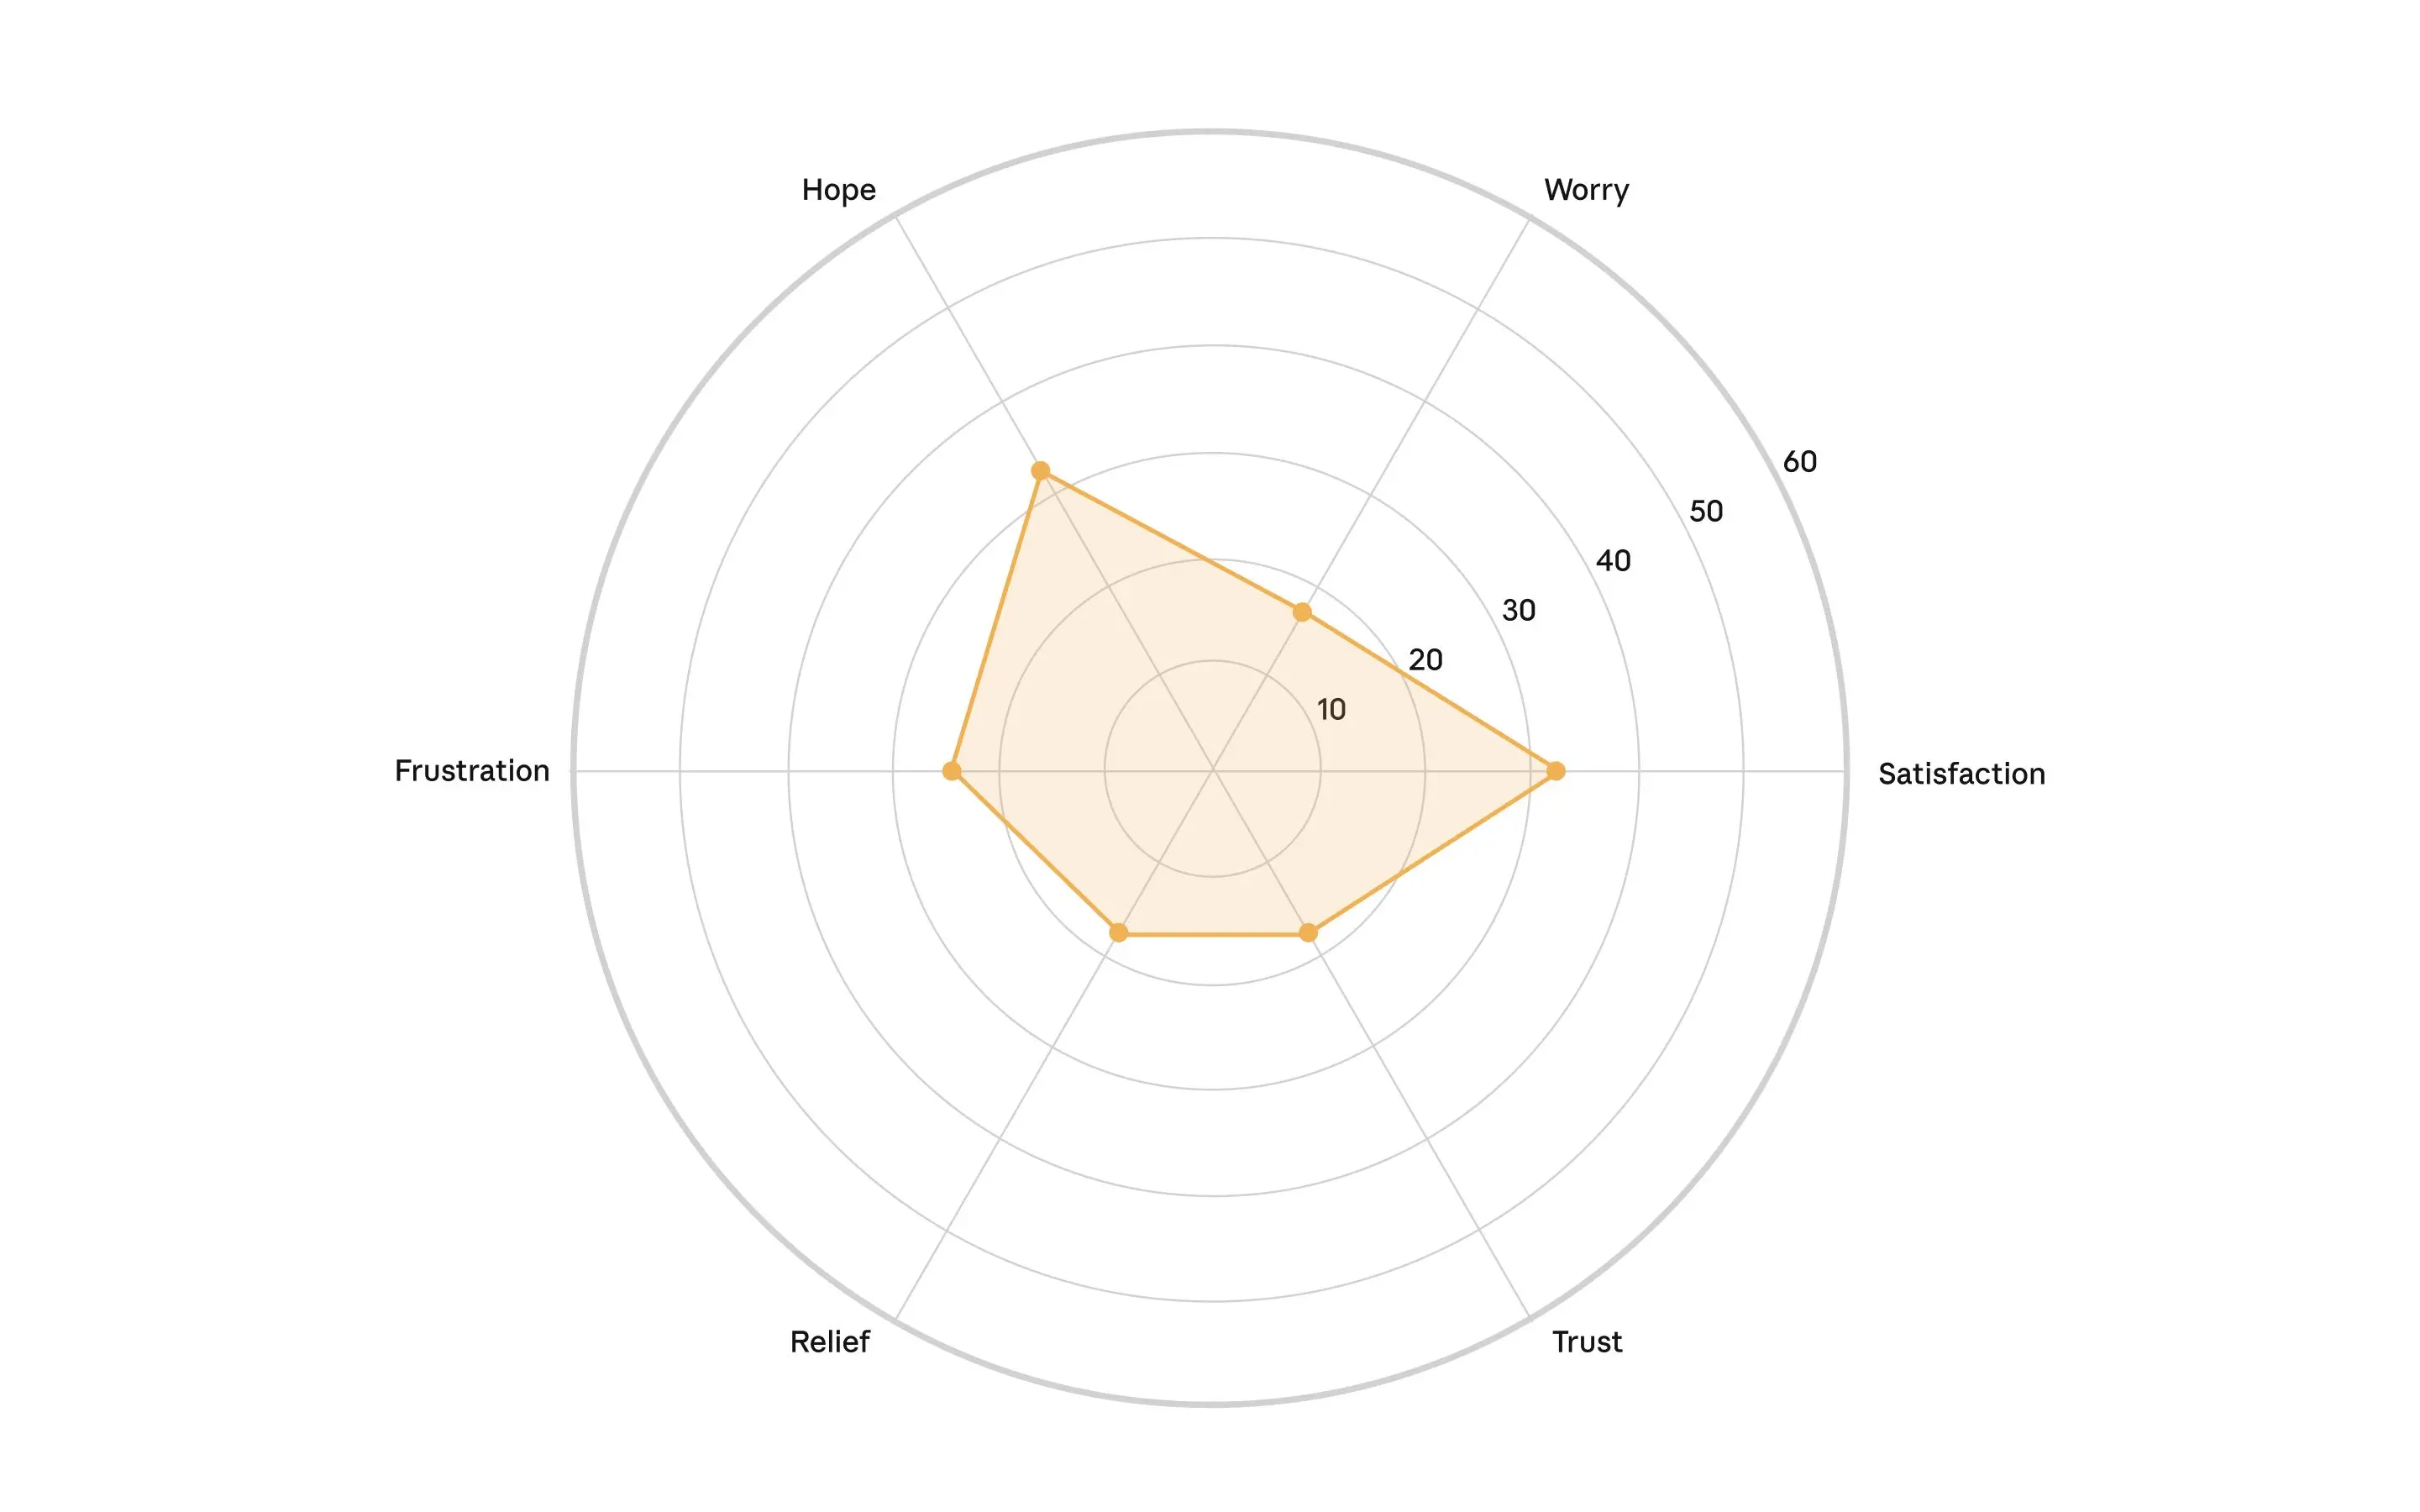
Intensity of the top six emotions—hope, worry, satisfaction, frustration, relief, and trust—reported during interviews with creative professionals. The axis denotes the percentage of interviews in which the participant expressed the given emotion. We analyzed these emotions across the six most prominent creative disciplines in our sample.Intensity of the top six emotions—hope, worry, satisfaction, frustration, relief, and trust—reported during interviews with creative professionals. The axis denotes the percentage of interviews in which the participant expressed the given emotion. We analyzed these emotions across the six most prominent creative disciplines in our sample.Intensity of the top six emotions—hope, worry, satisfaction, frustration, relief, and trust—reported during interviews with creative professionals. The axis denotes the percentage of interviews in which the participant expressed the given emotion. We analyzed these emotions across the six most prominent creative disciplines in our sample.Intensity of the top six emotions—hope, worry, satisfaction, frustration, relief, and trust—reported during interviews with creative professionals. The axis denotes the percentage of interviews in which the participant expressed the given emotion. We analyzed these emotions across the six most prominent creative disciplines in our sample.Intensity of the top six emotions—hope, worry, satisfaction, frustration, relief, and trust—reported during interviews with creative professionals. The axis denotes the percentage of interviews in which the participant expressed the given emotion. We analyzed these emotions across the six most prominent creative disciplines in our sample.Intensity of the top six emotions—hope, worry, satisfaction, frustration, relief, and trust—reported during interviews with creative professionals. The axis denotes the percentage of interviews in which the participant expressed the given emotion. We analyzed these emotions across the six most prominent creative disciplines in our sample.
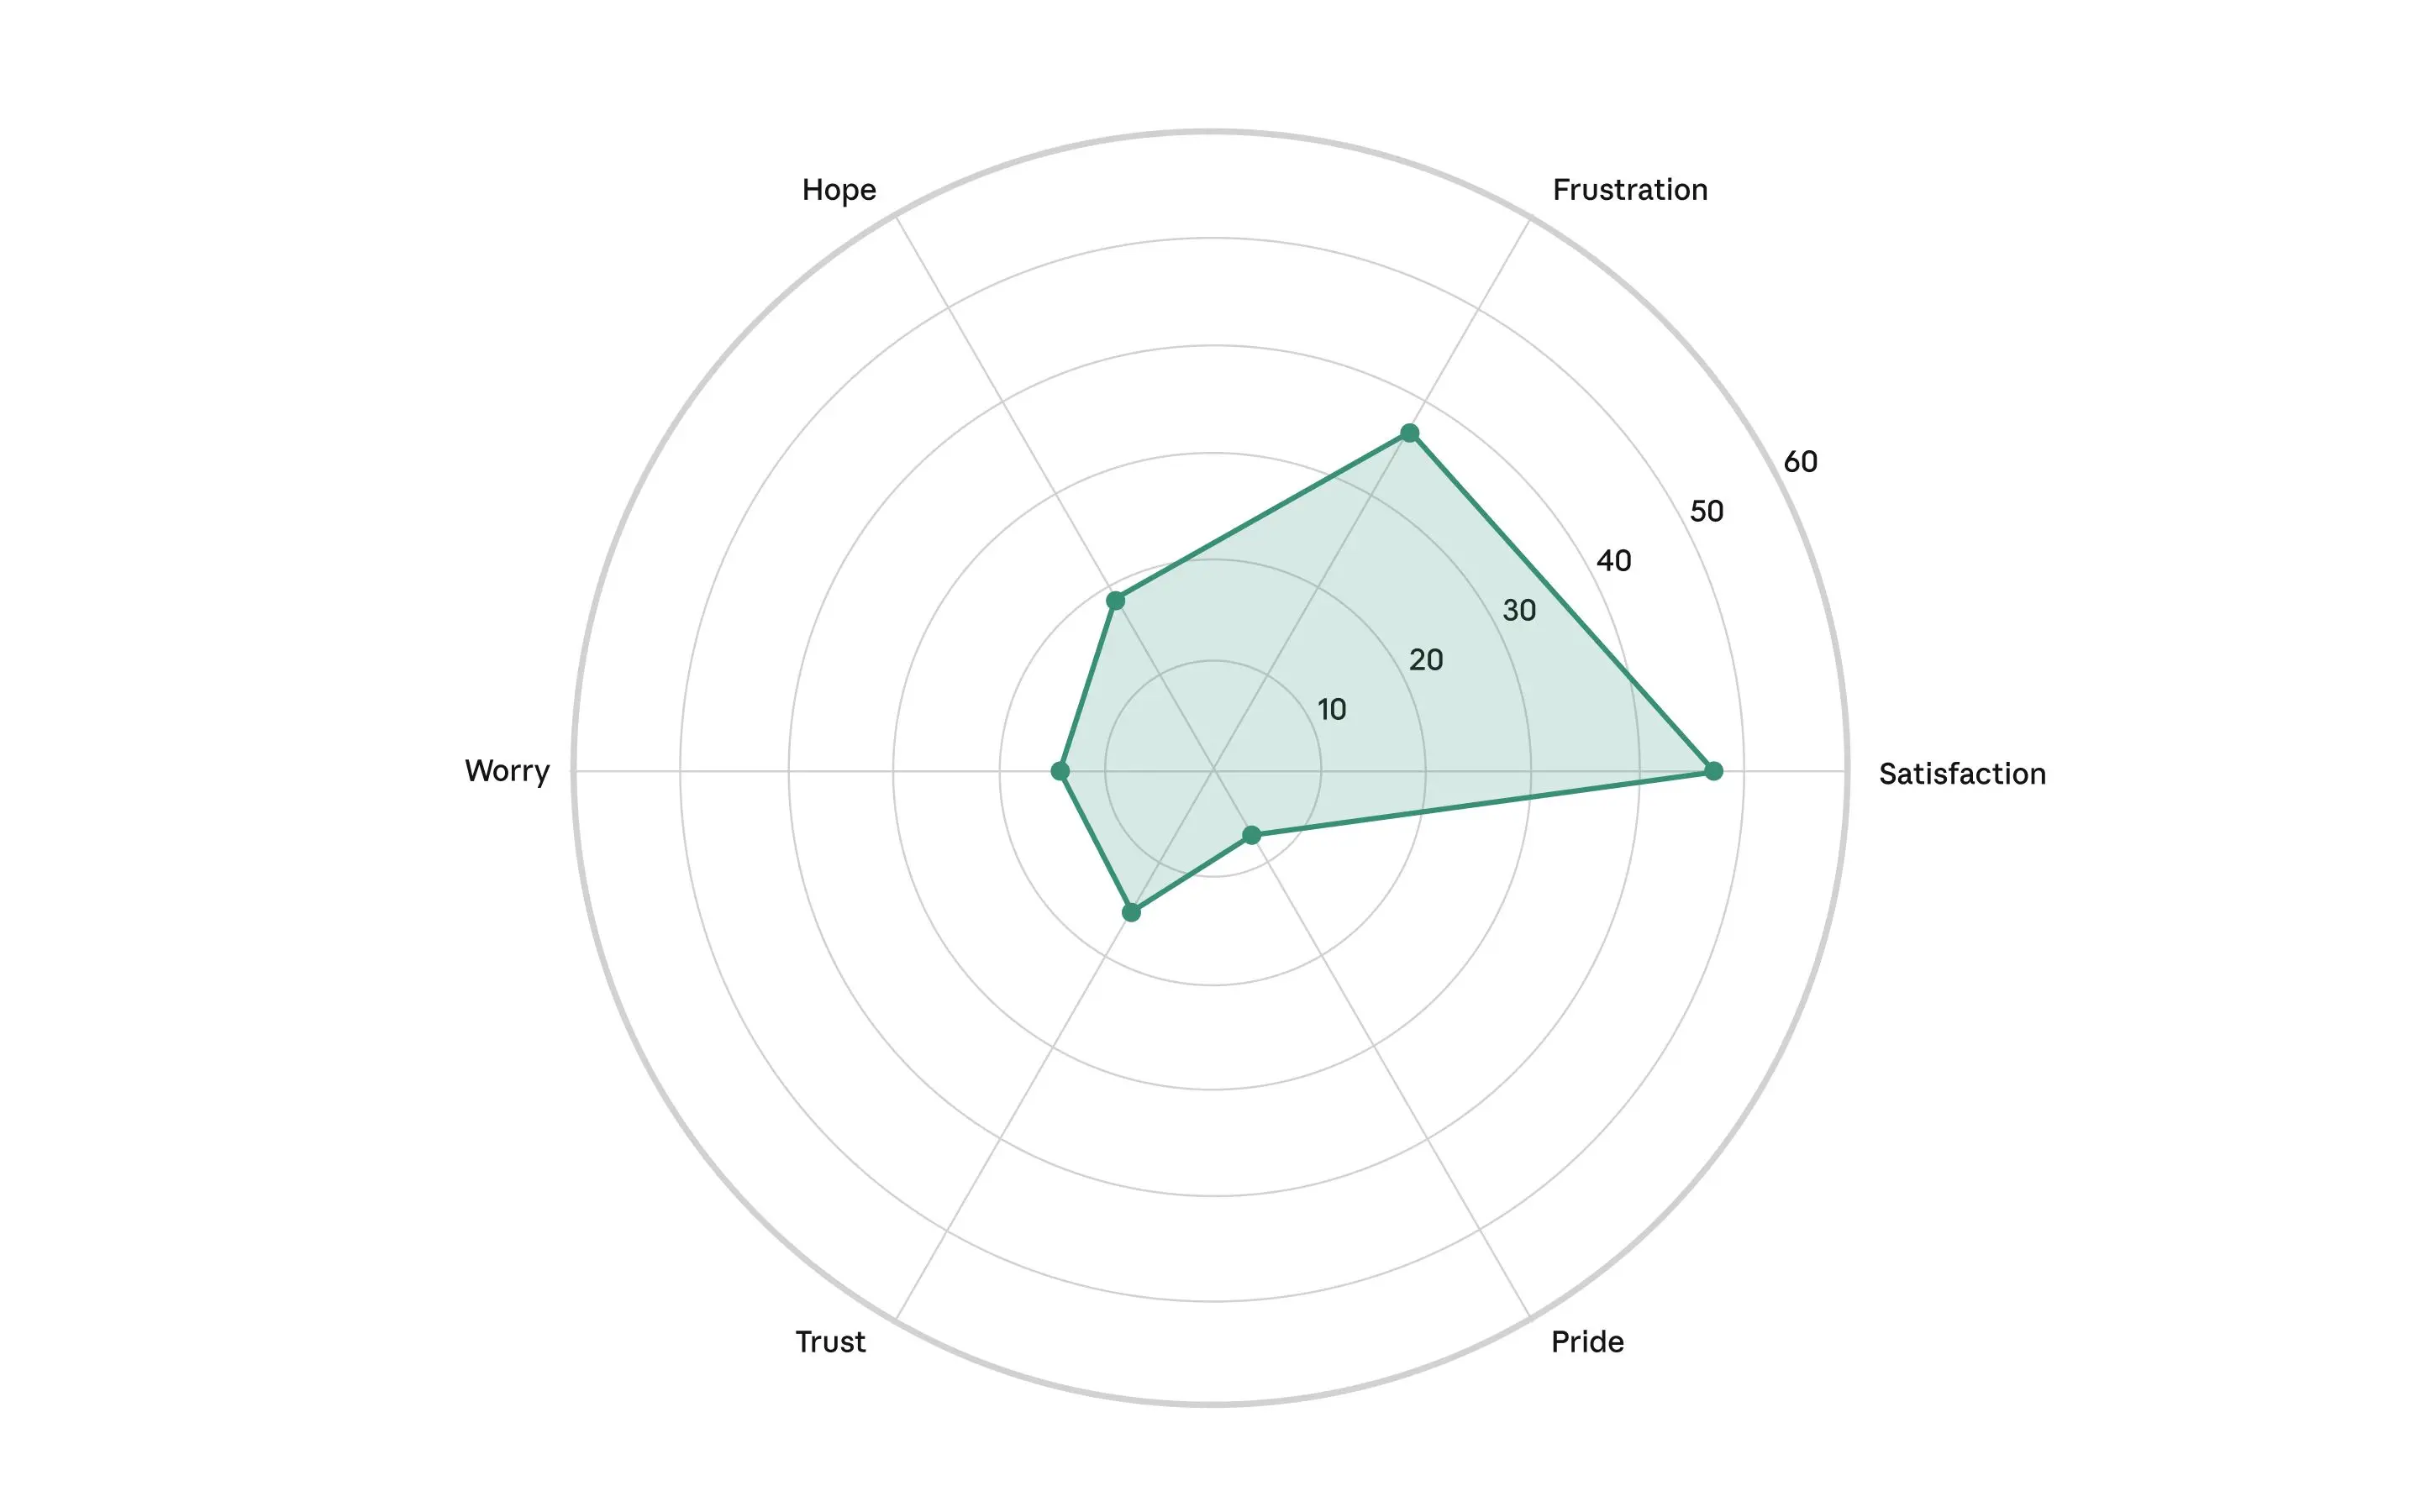
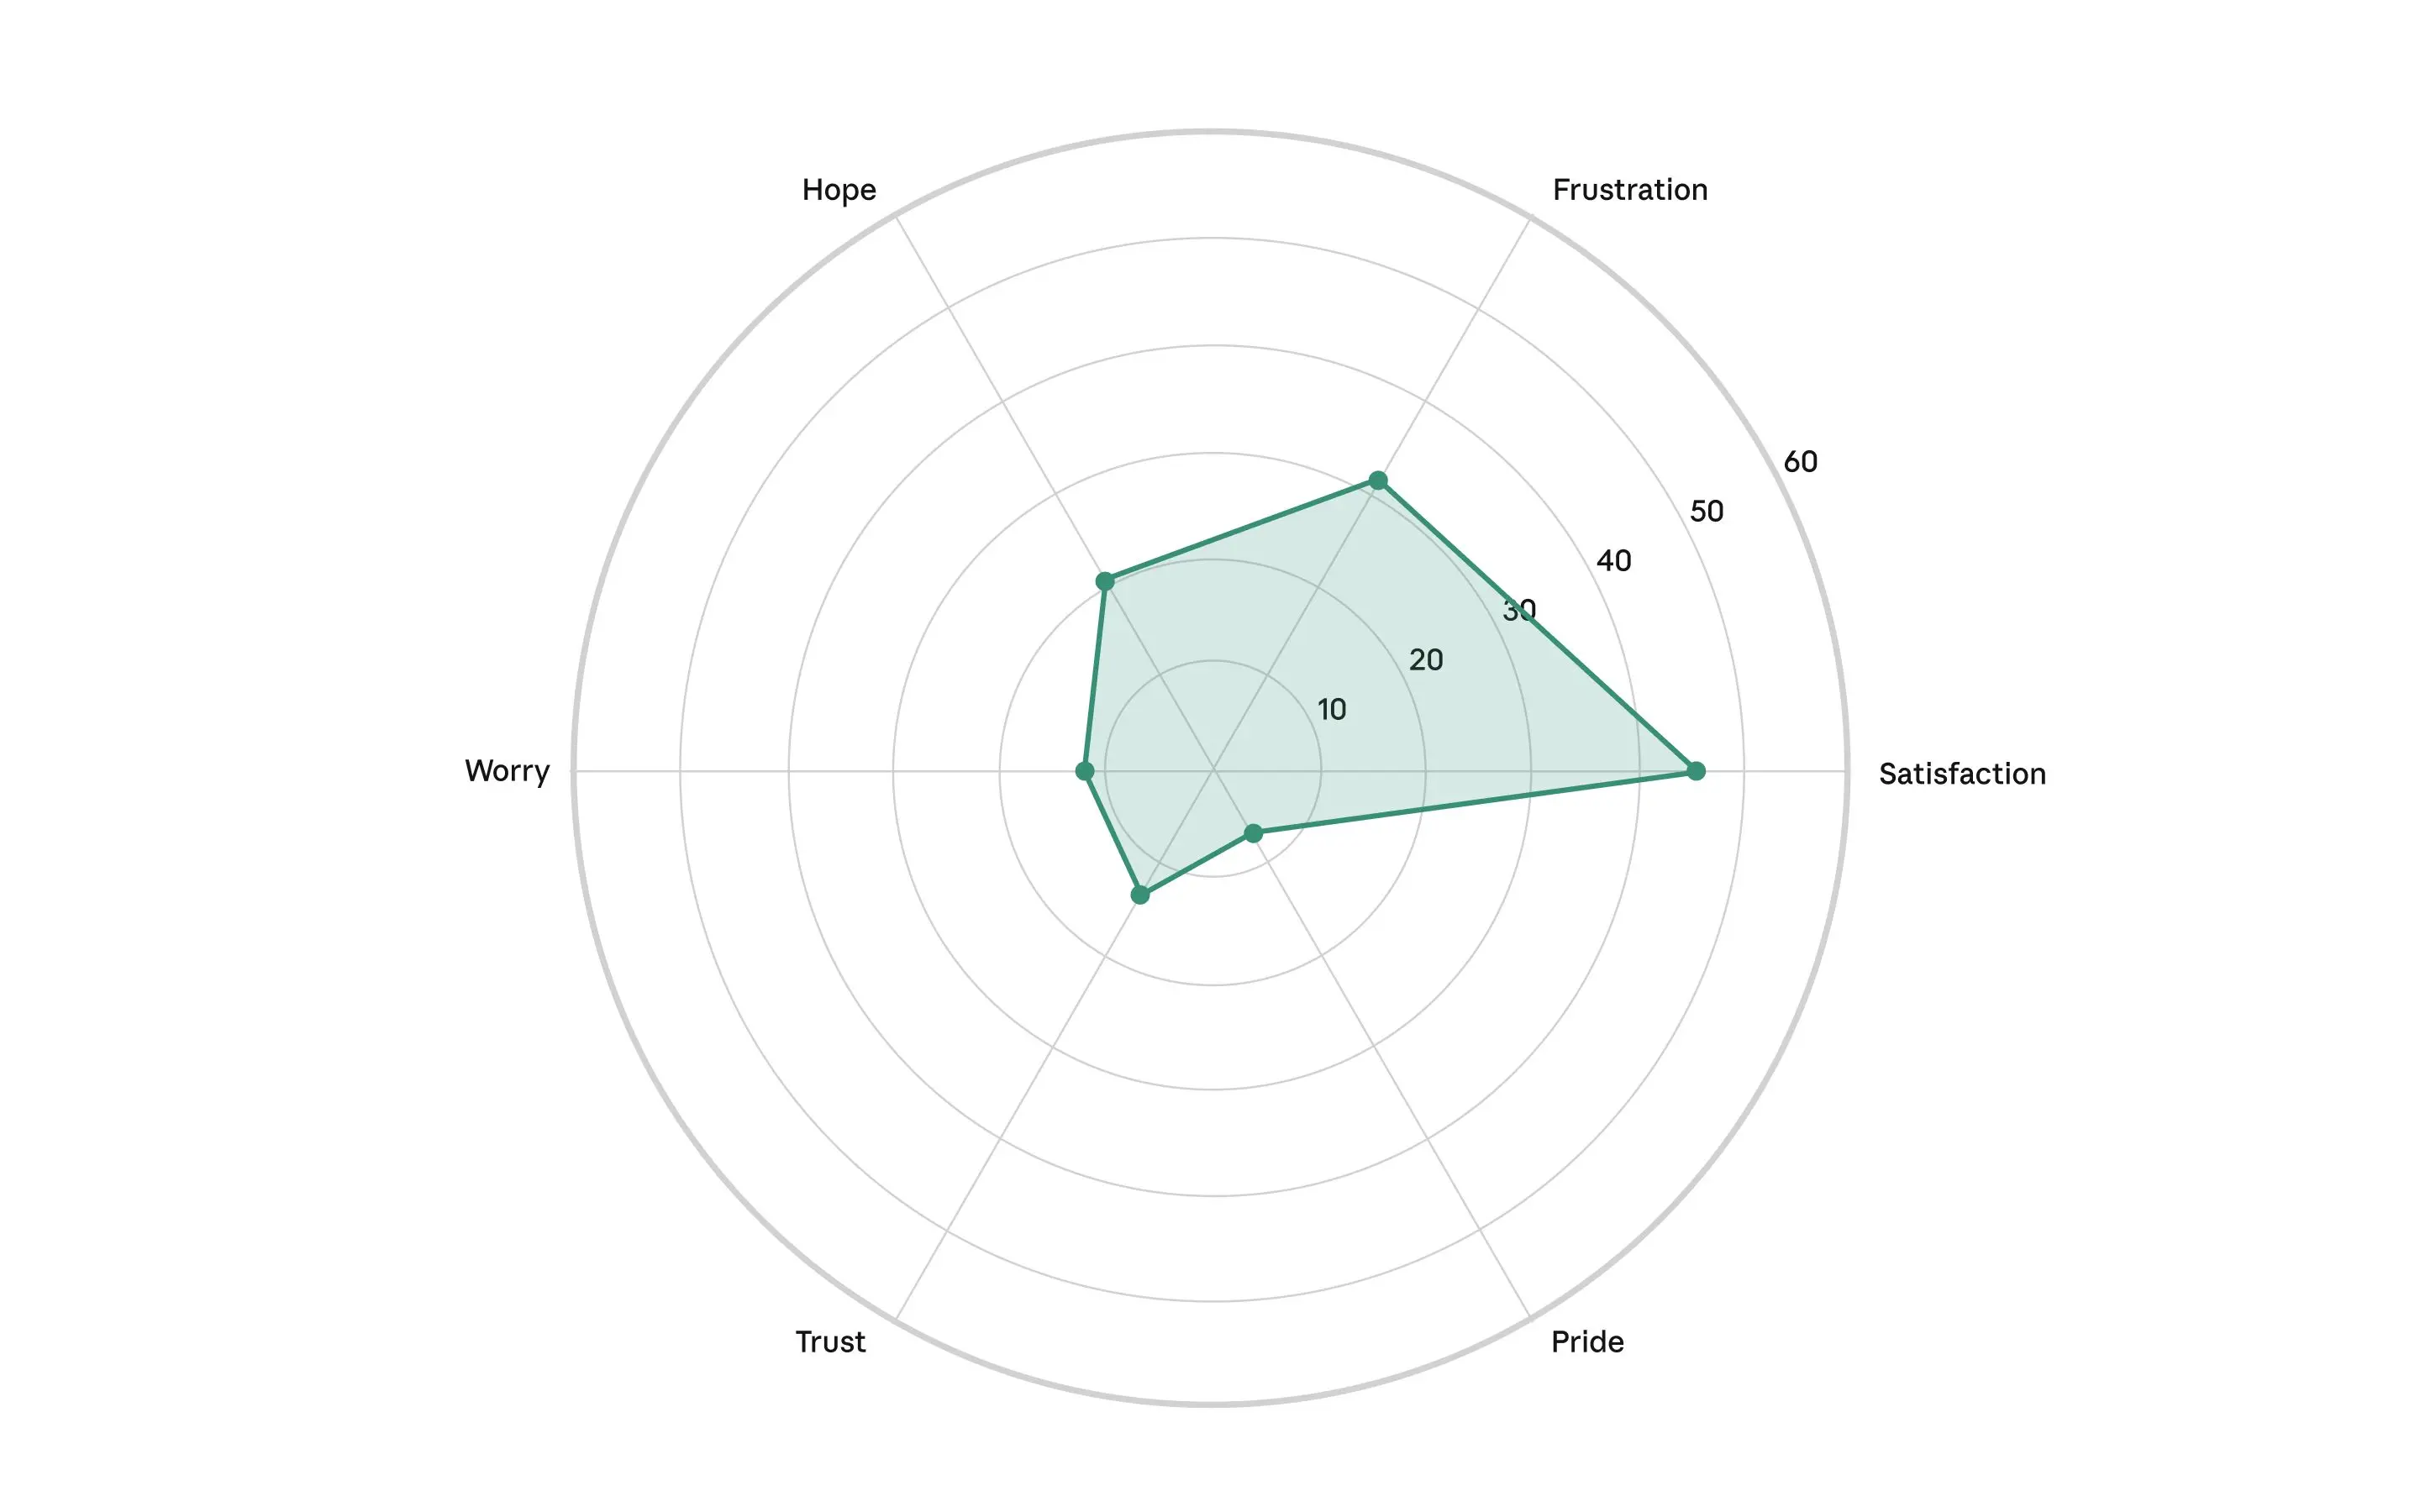
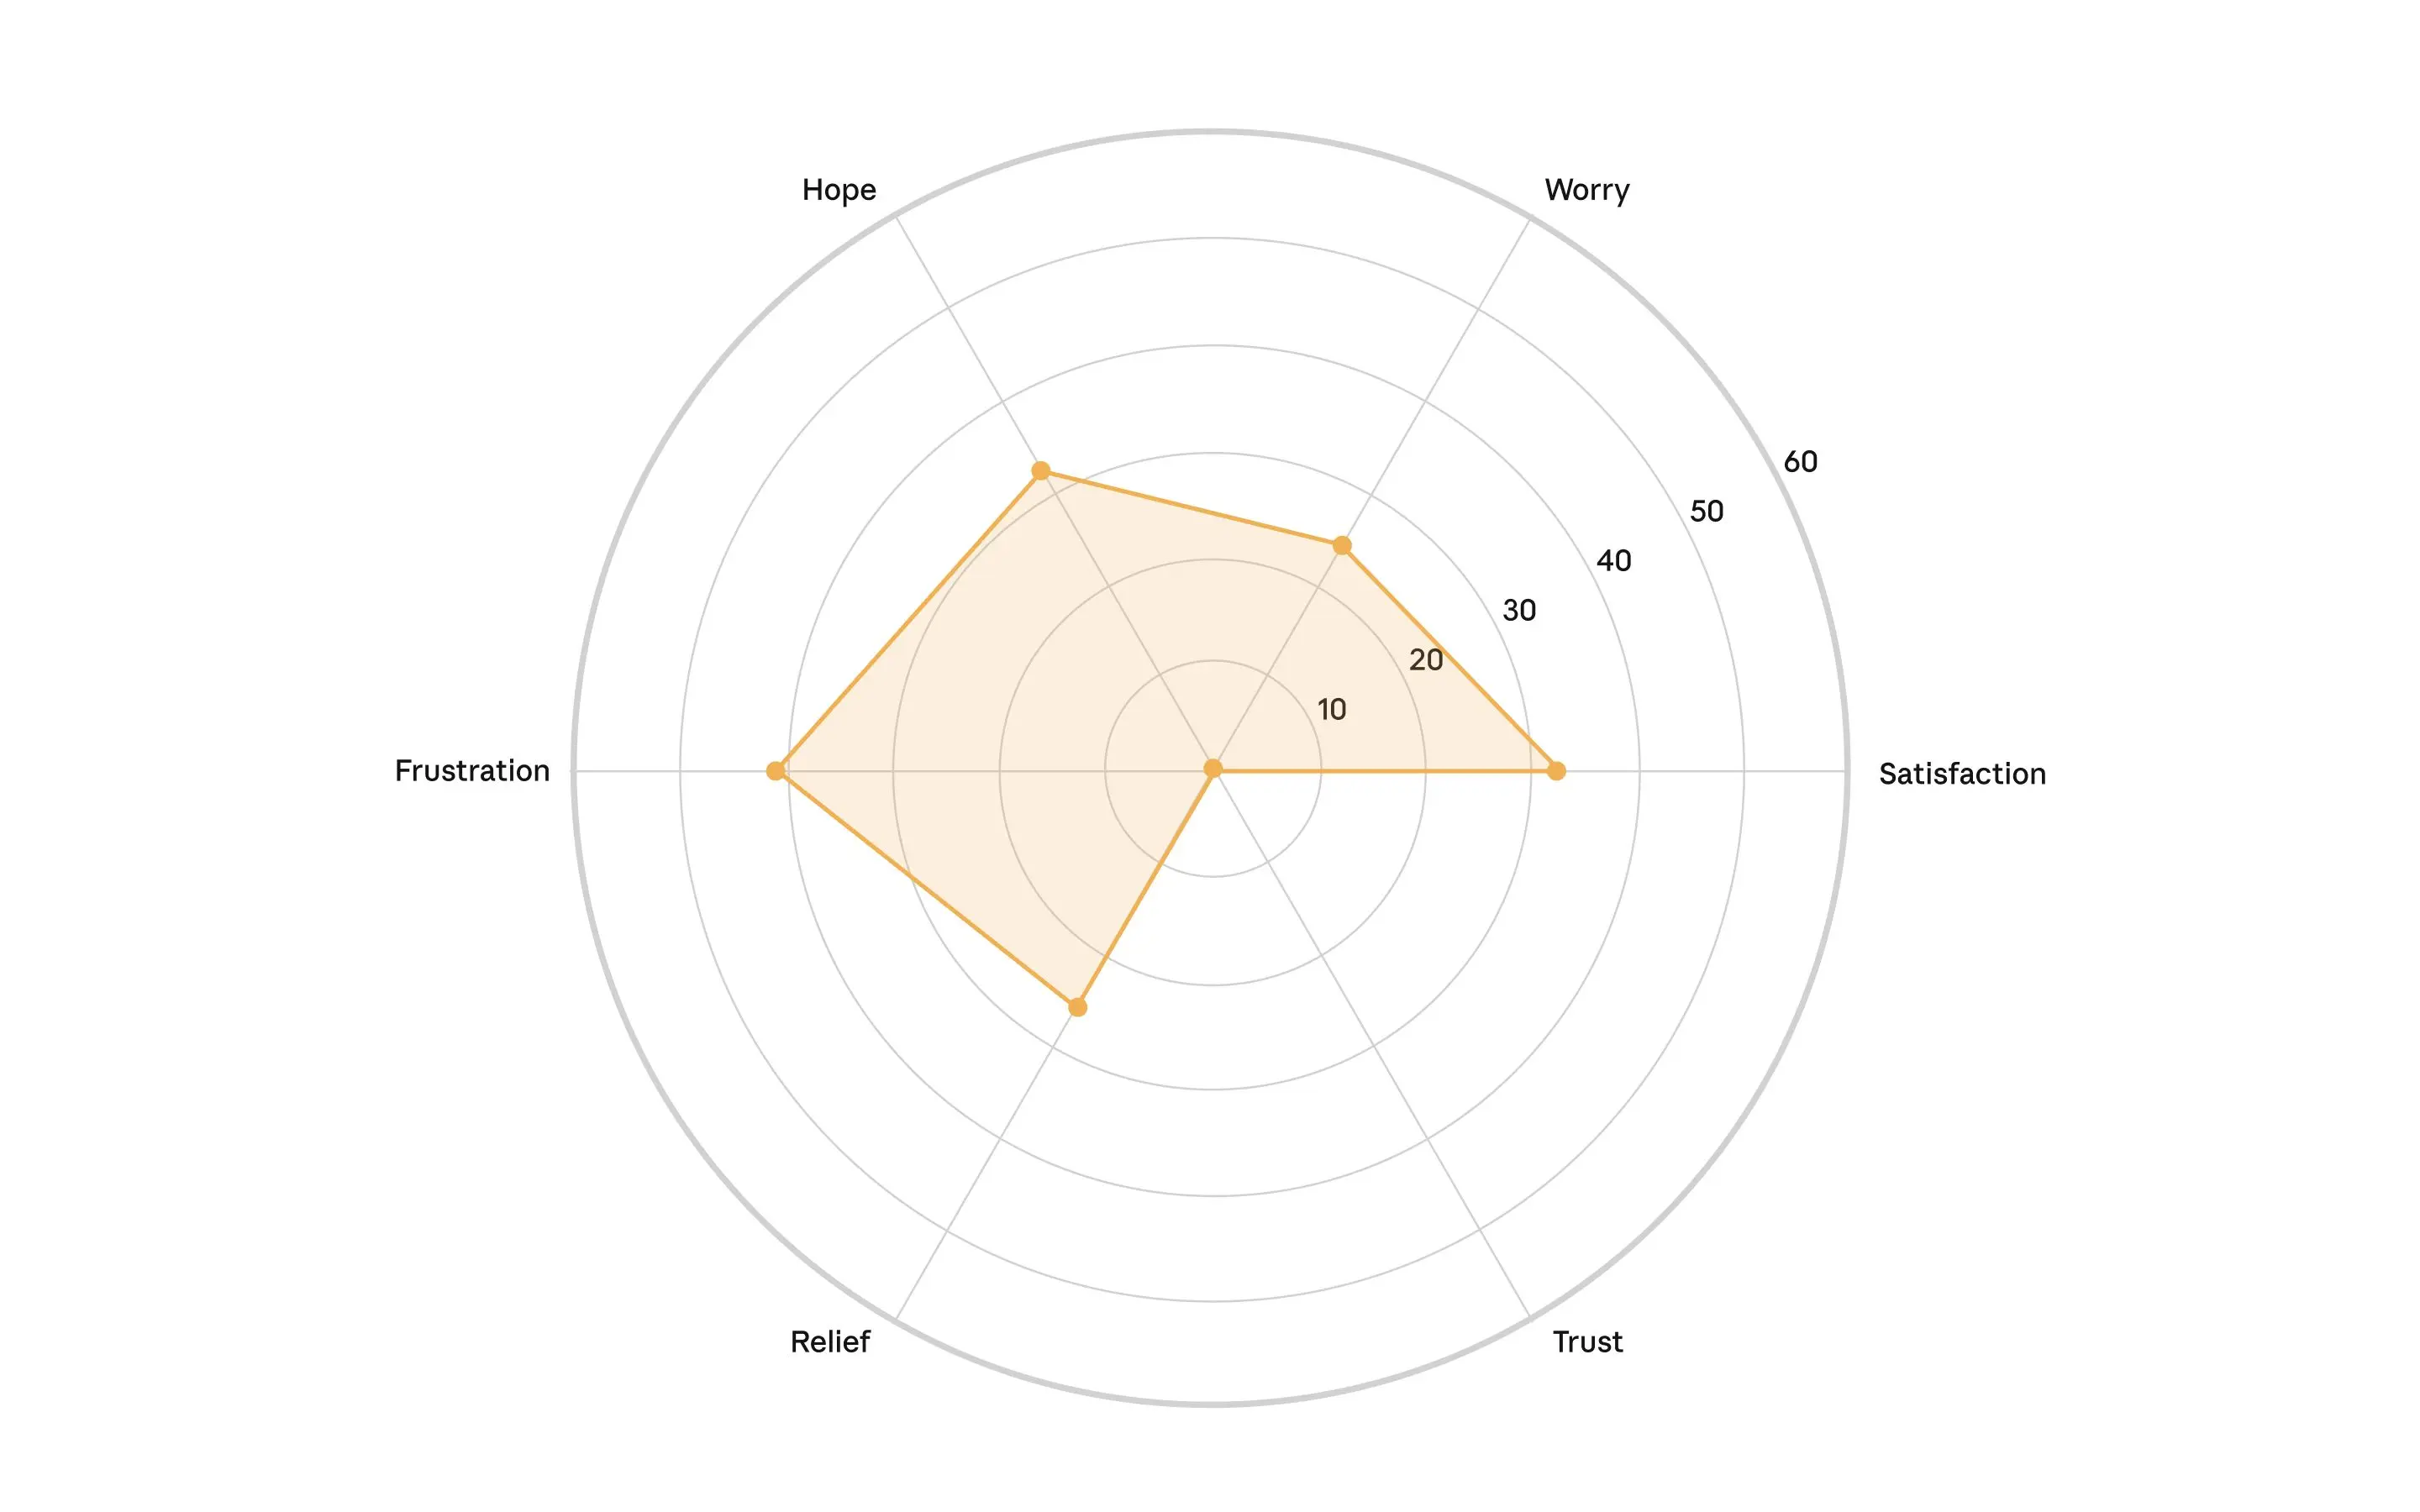
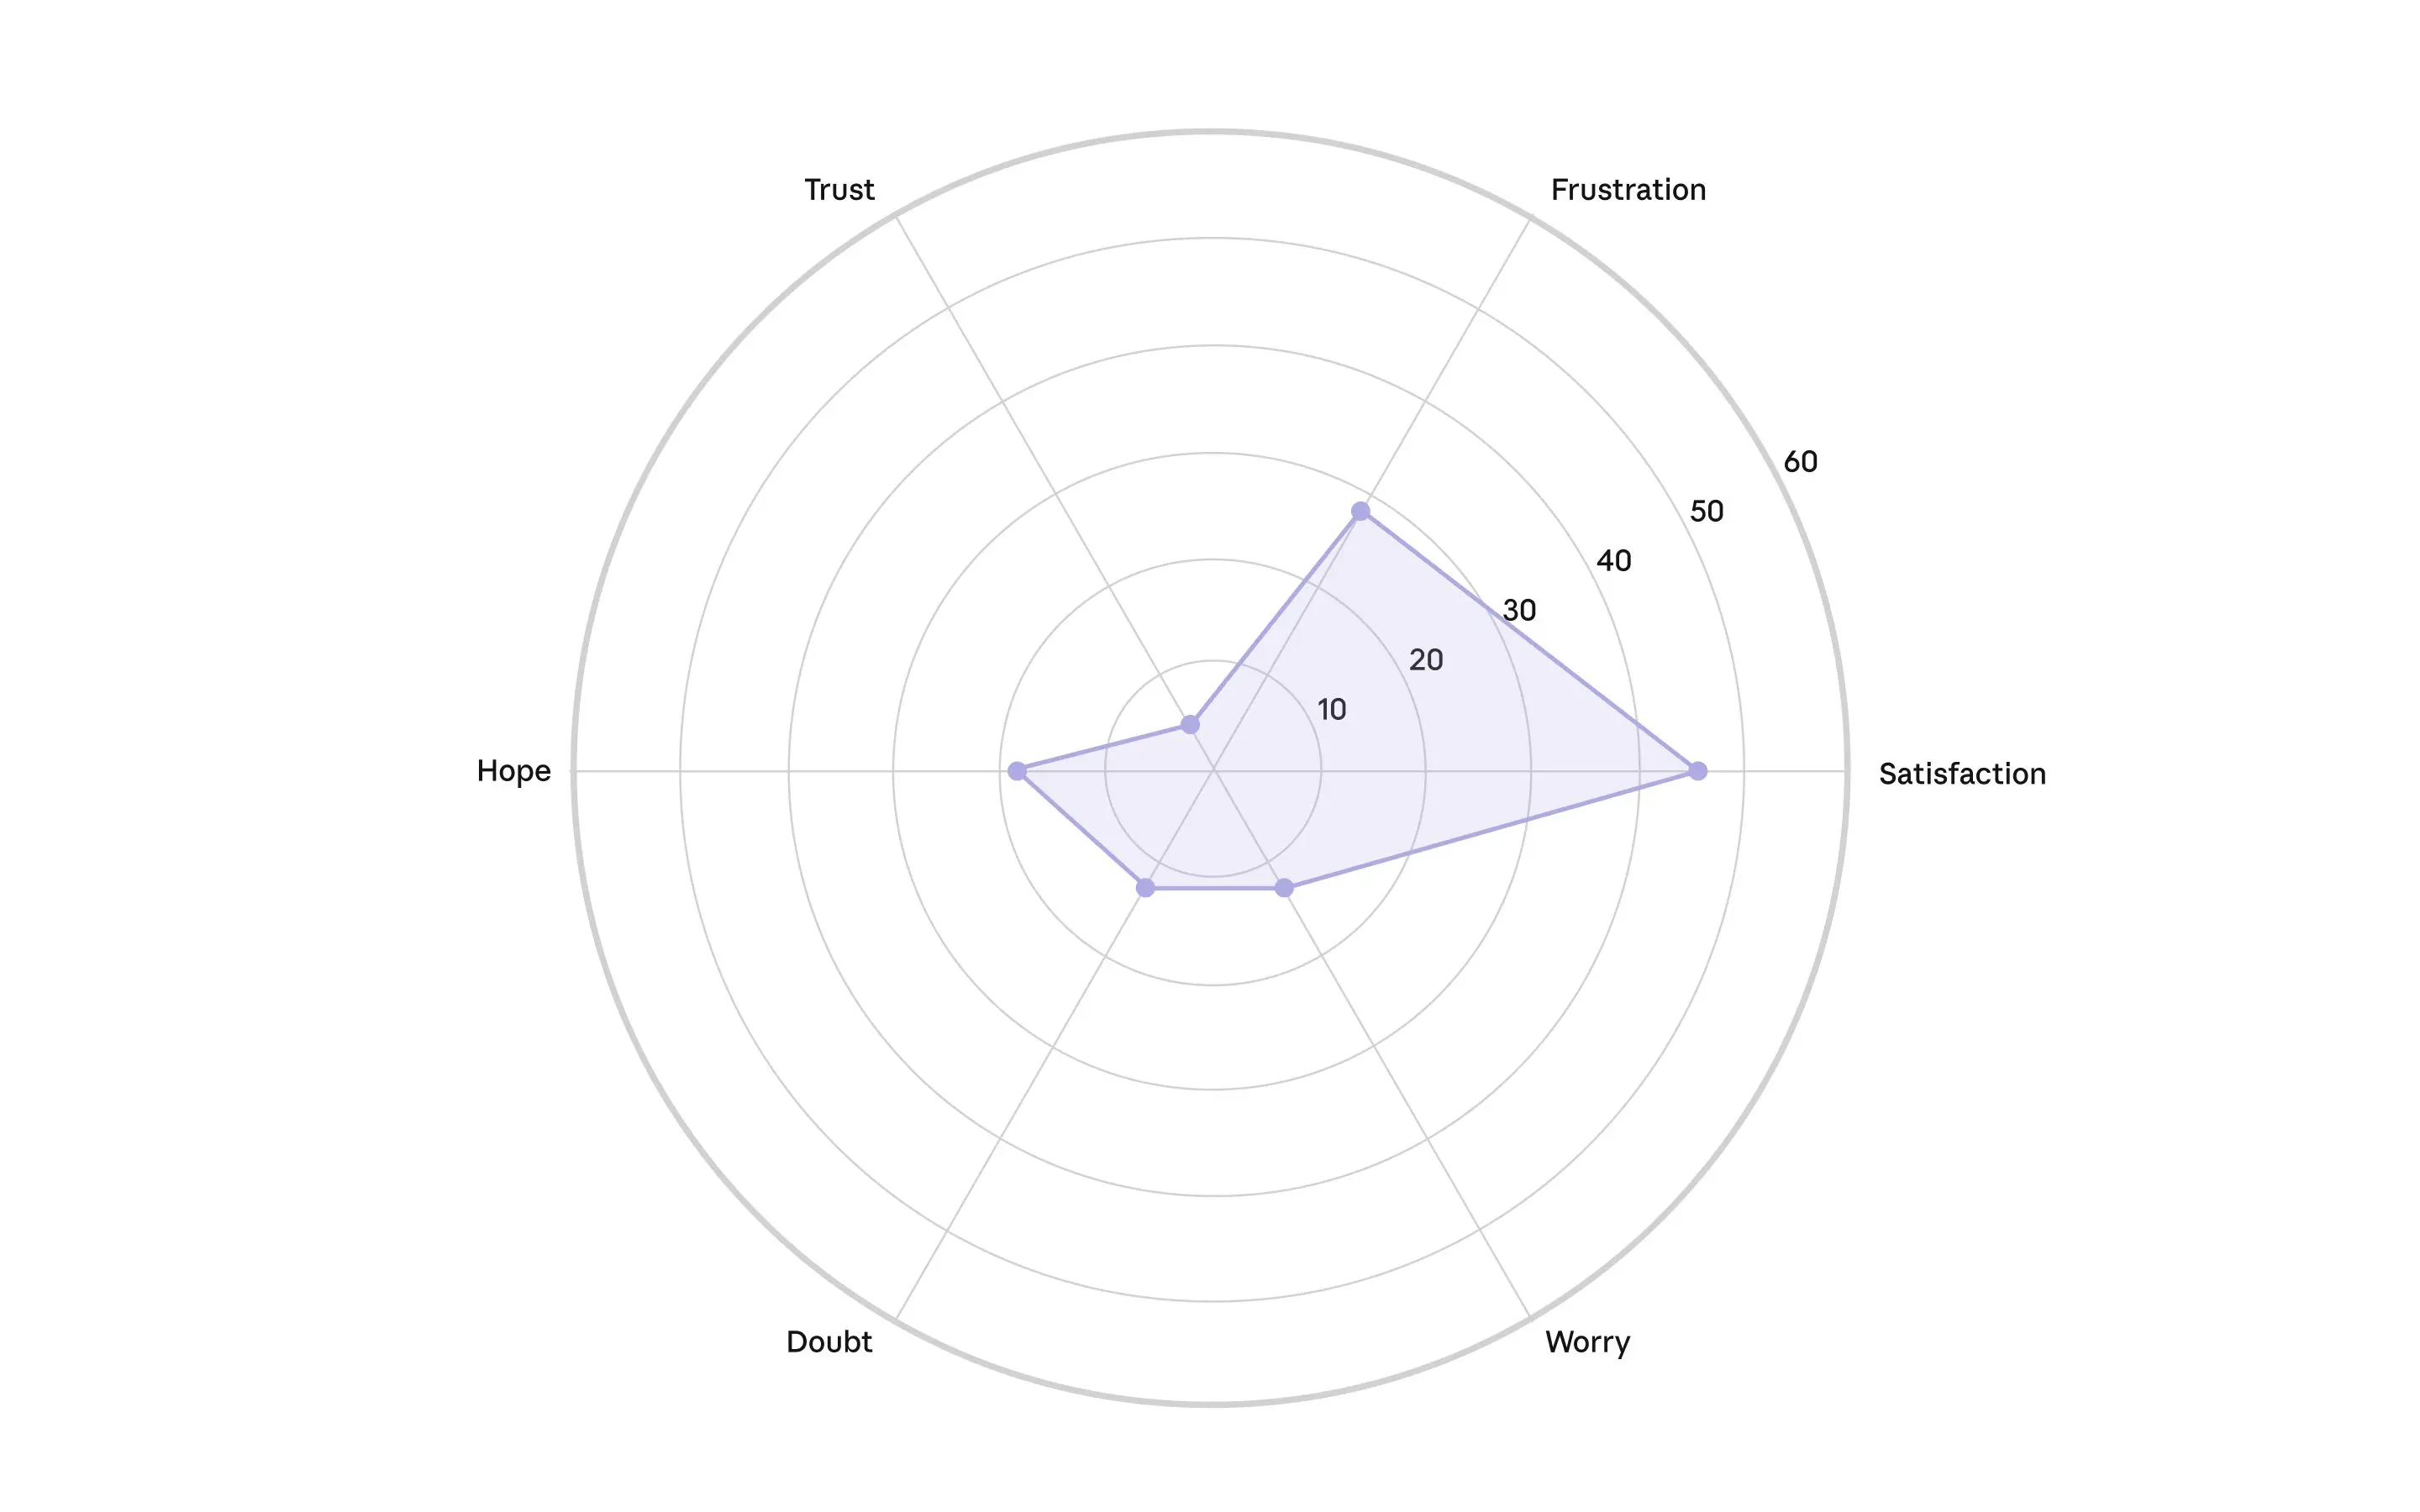
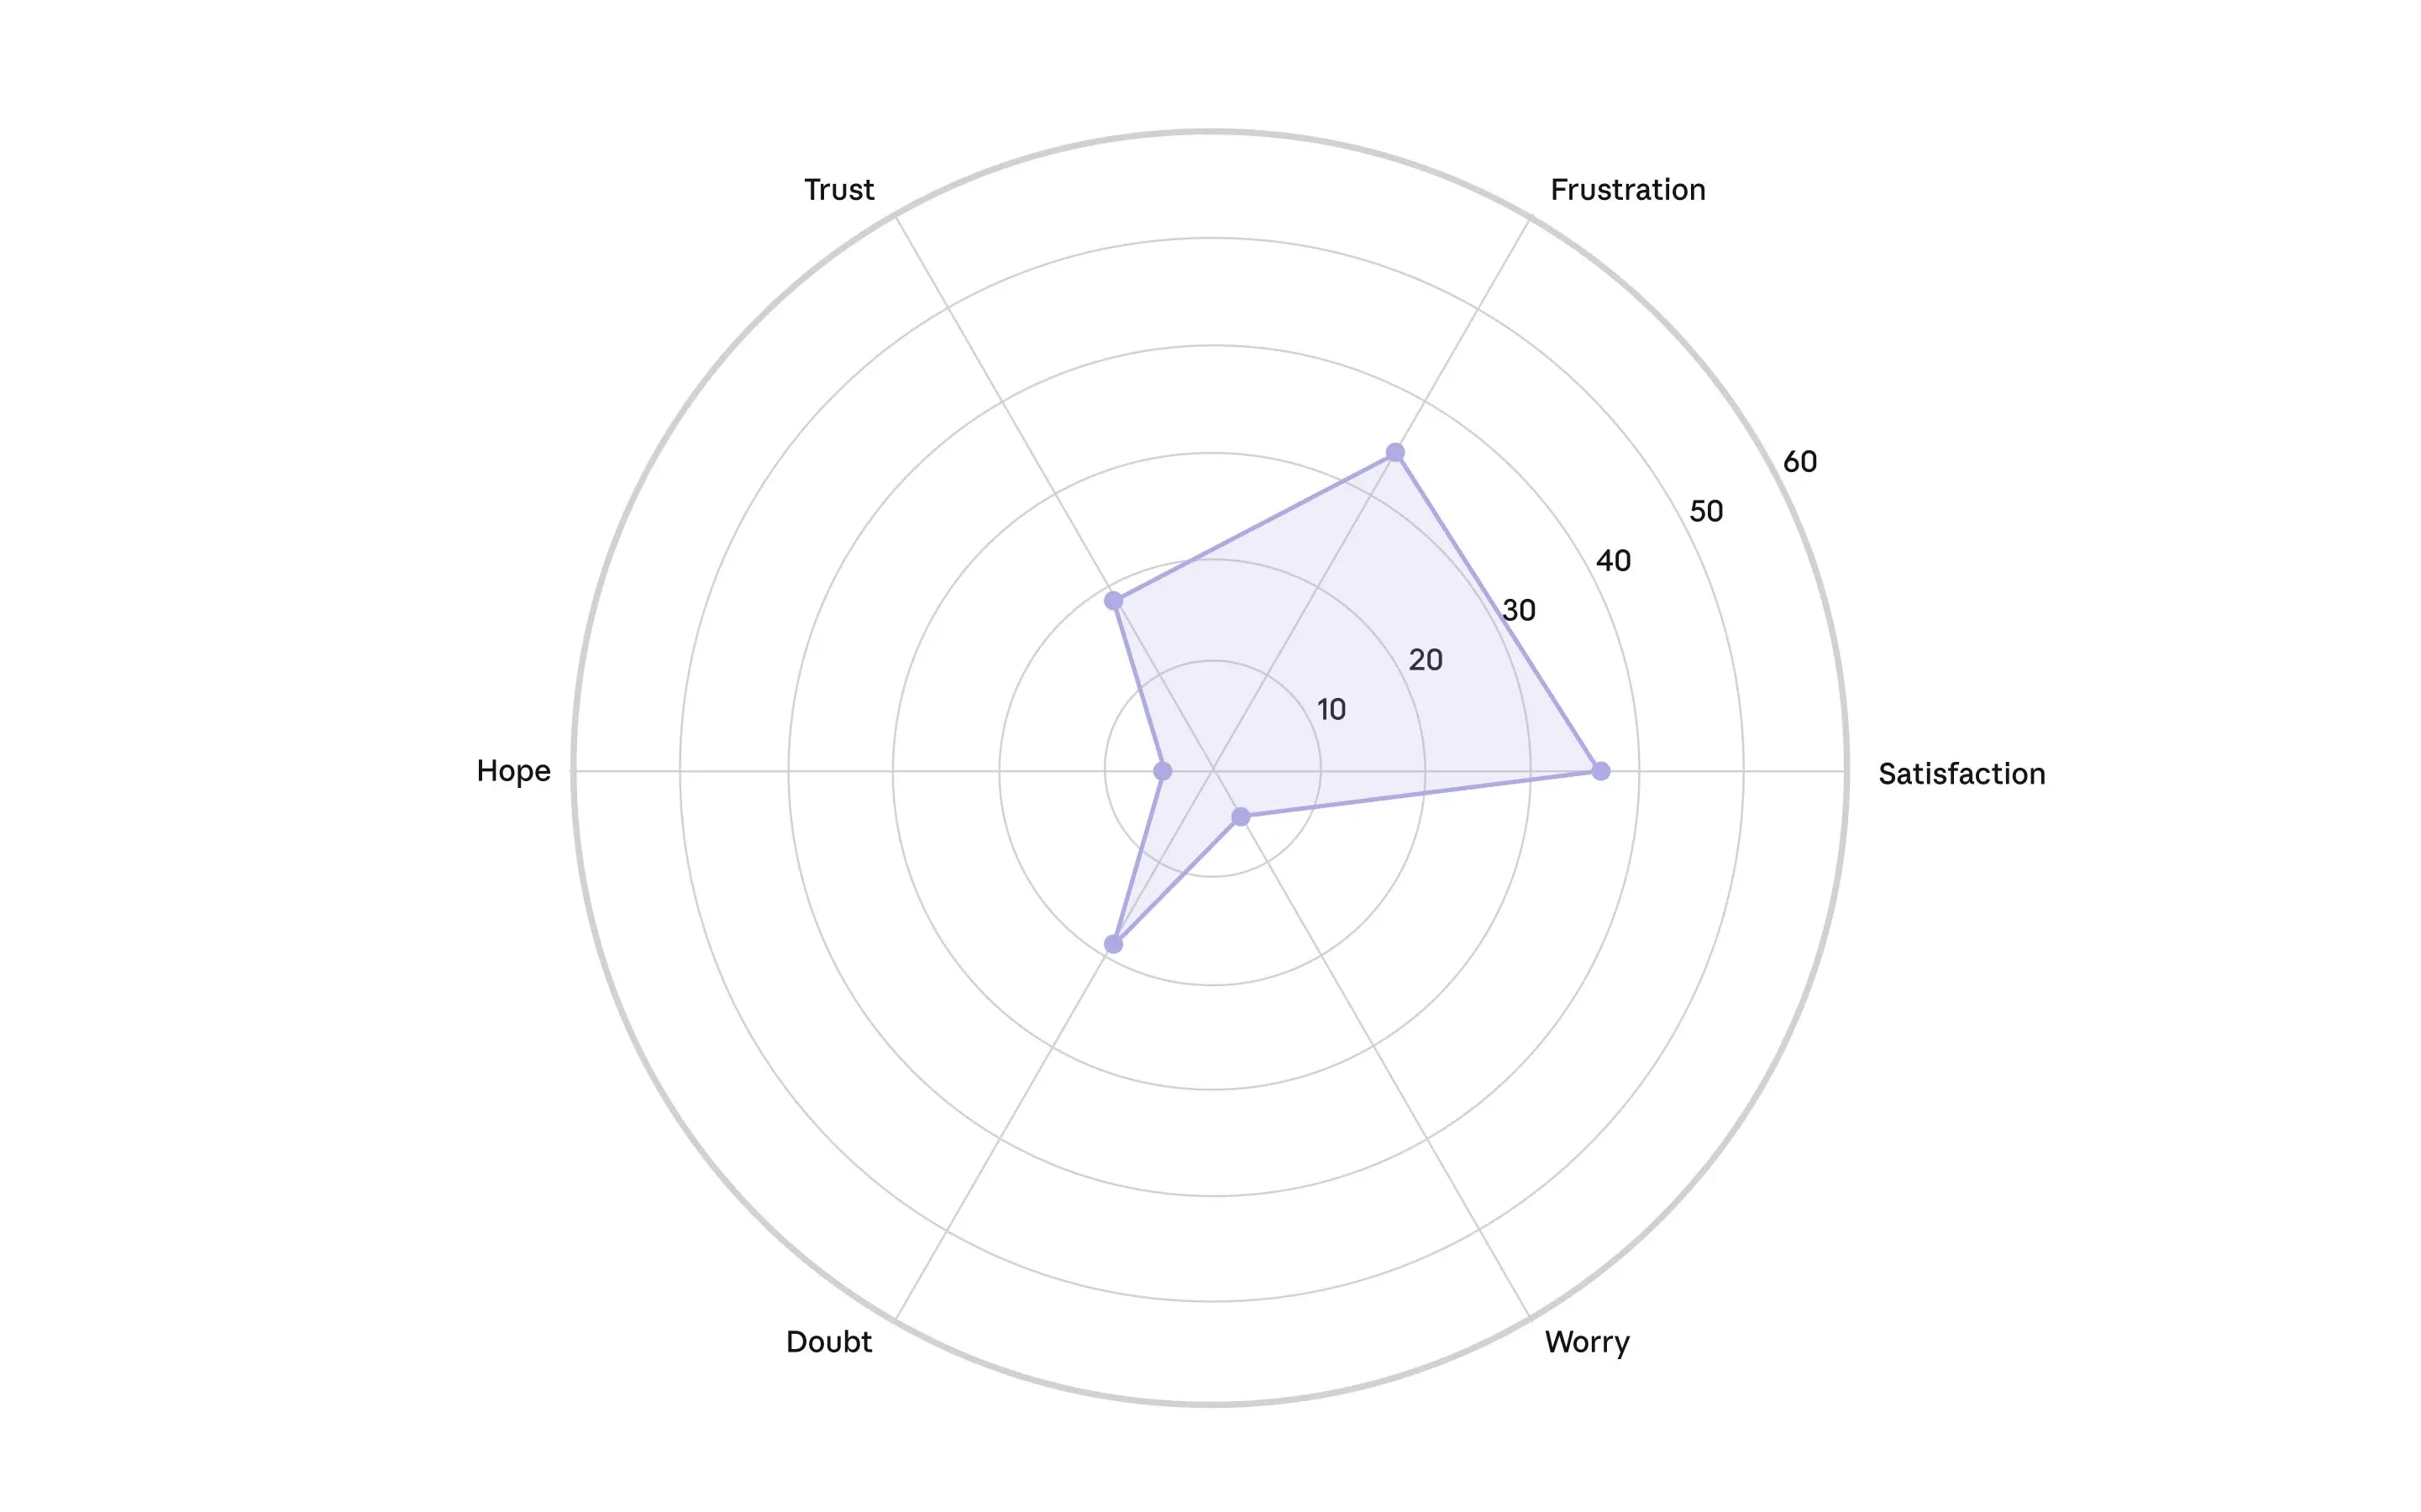
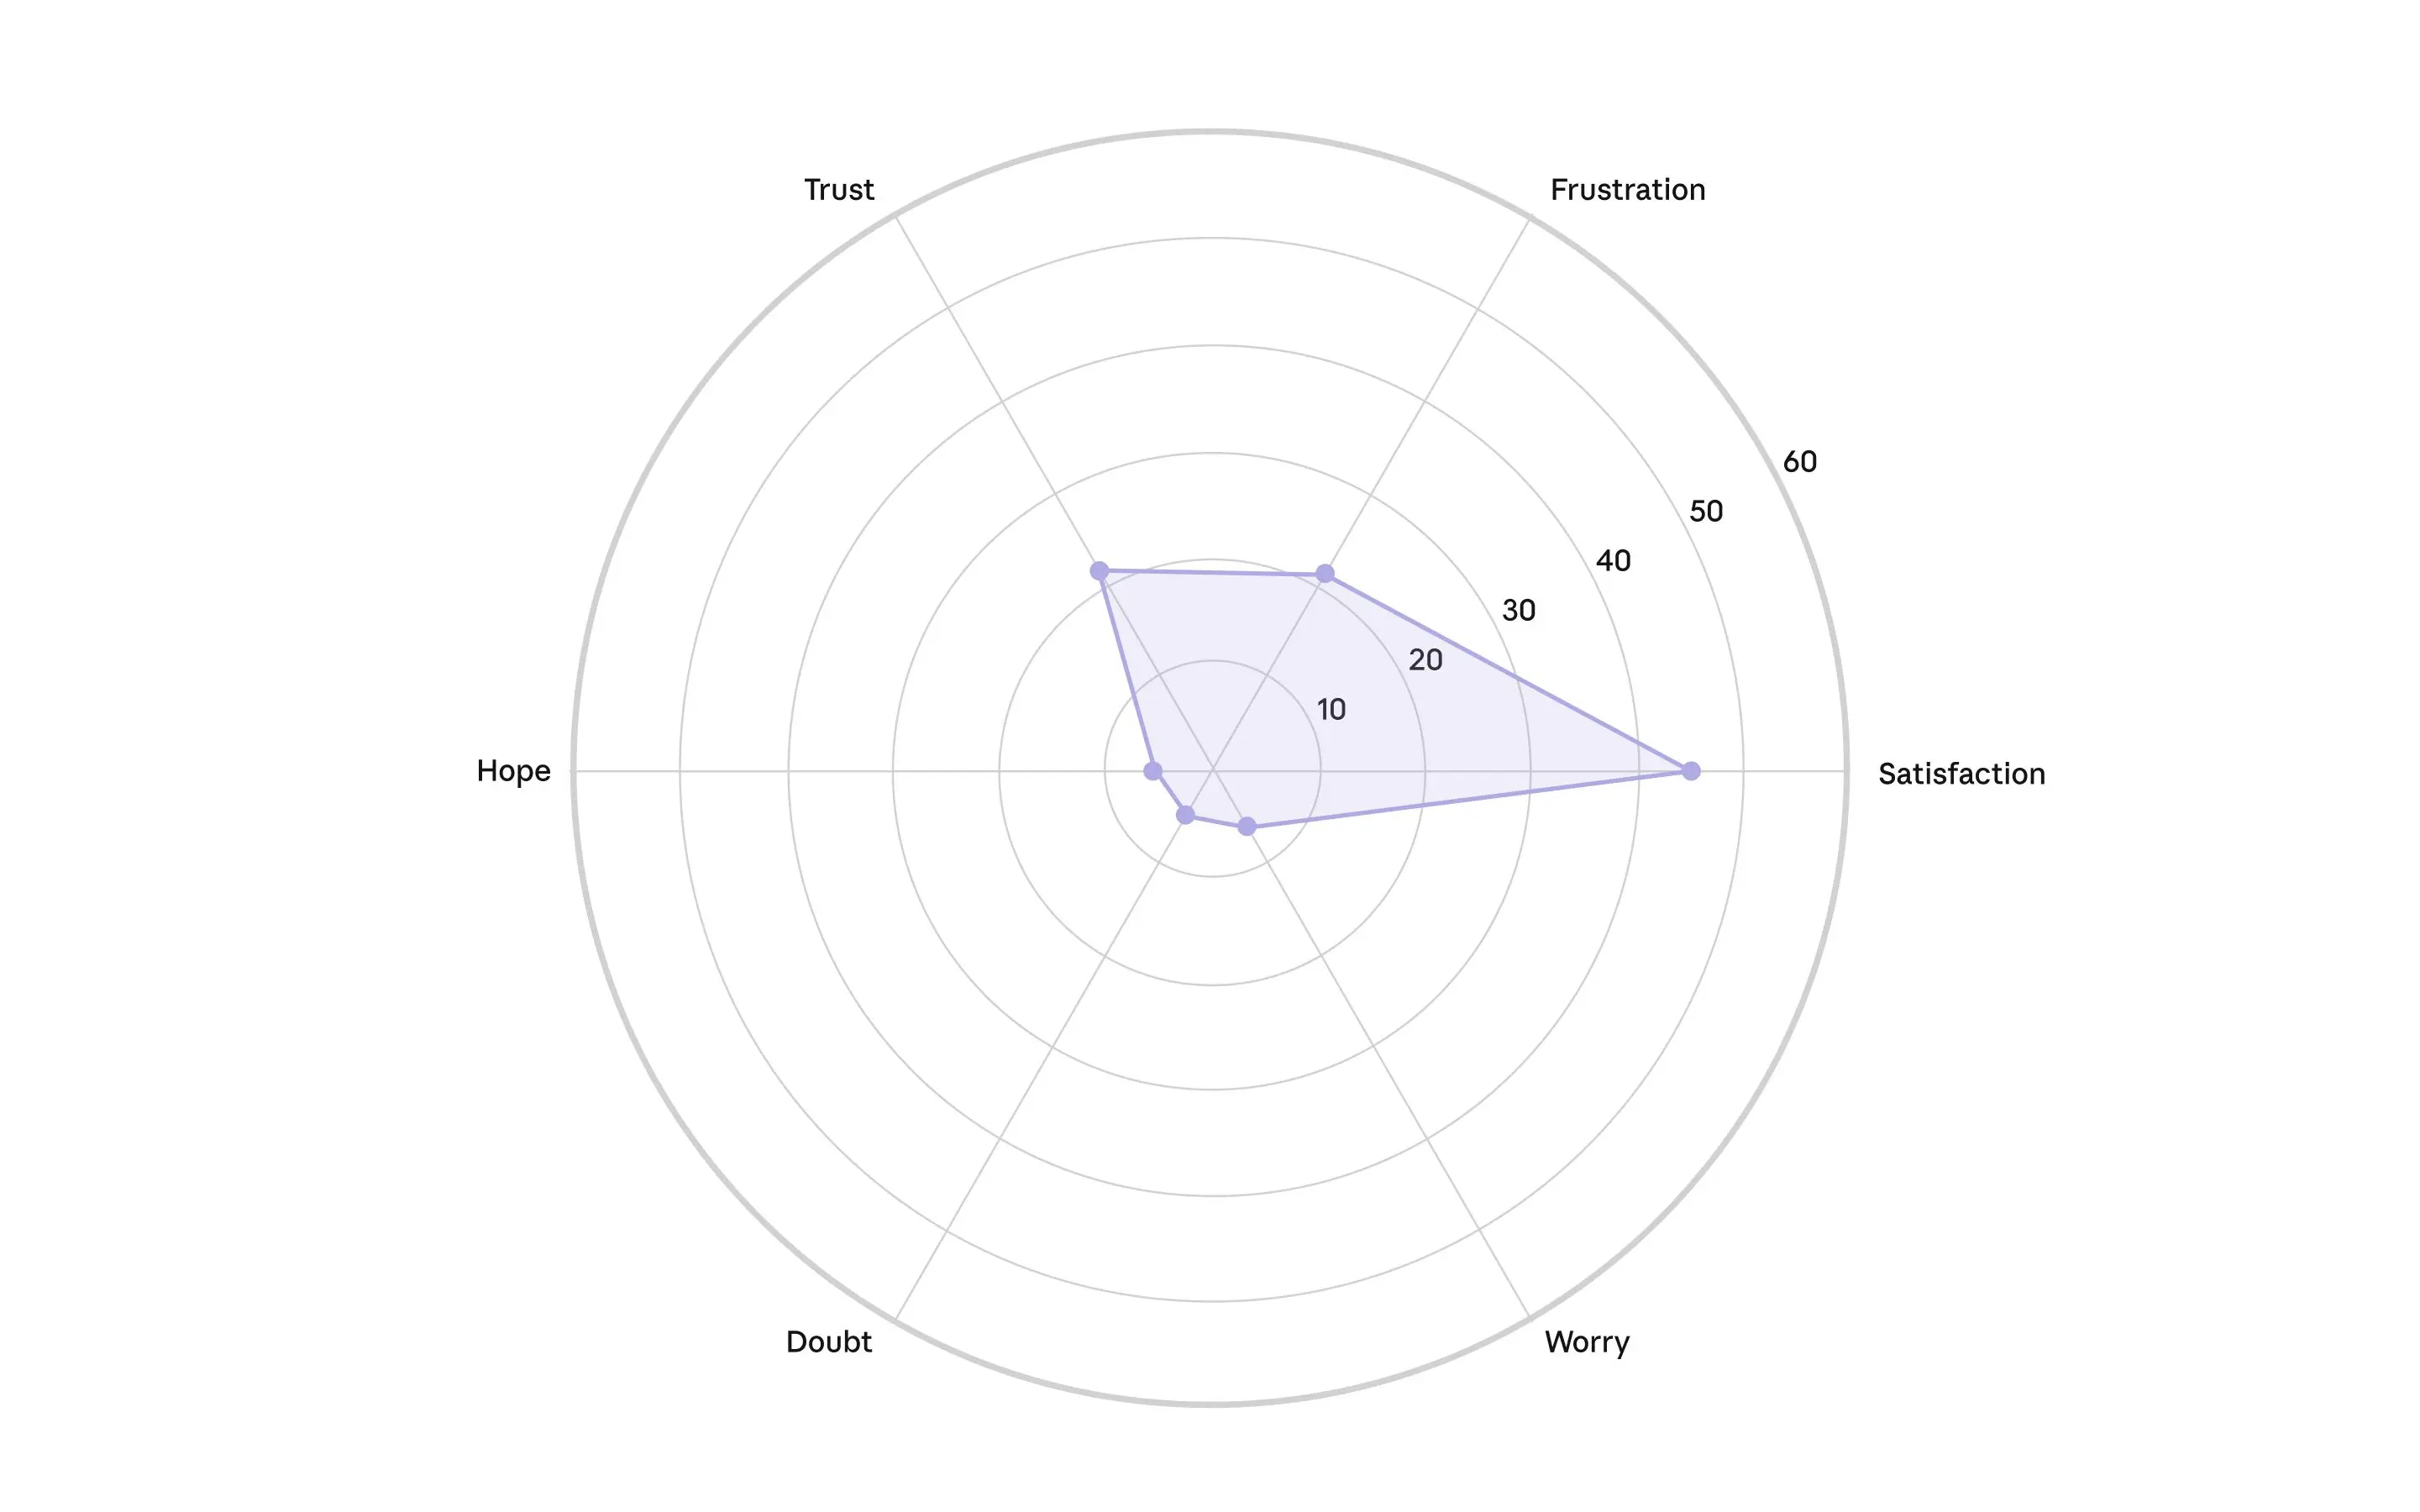
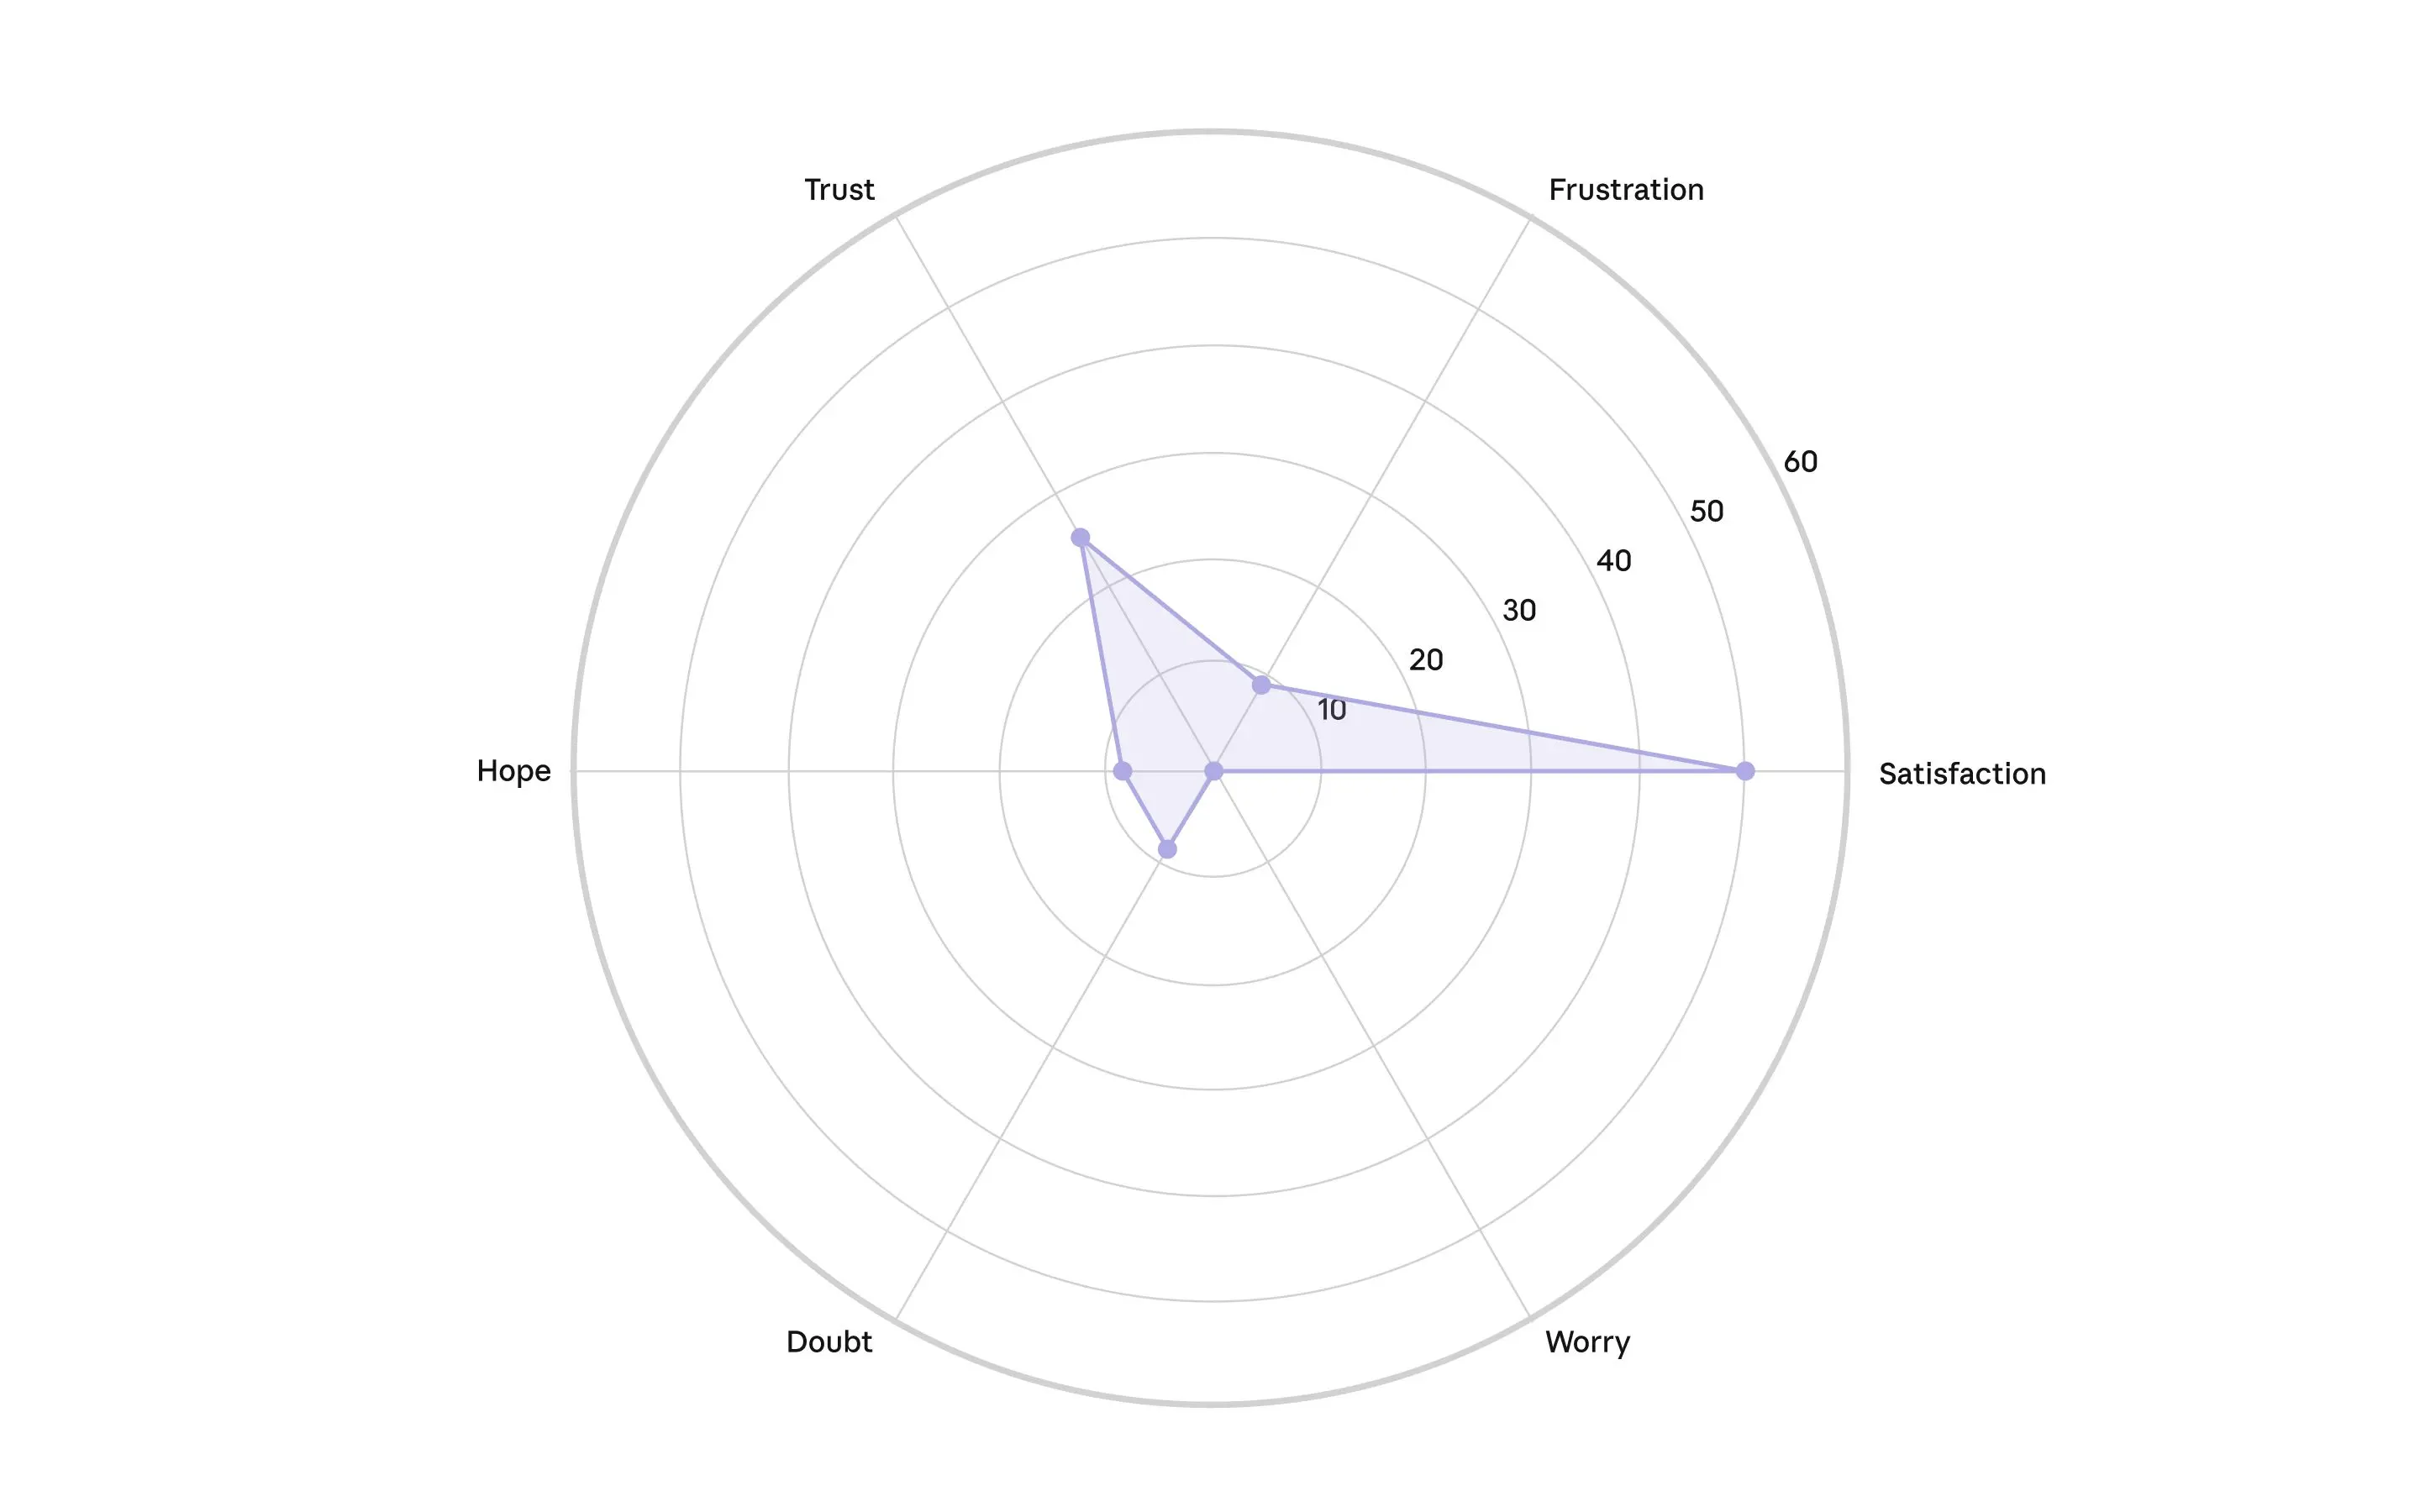
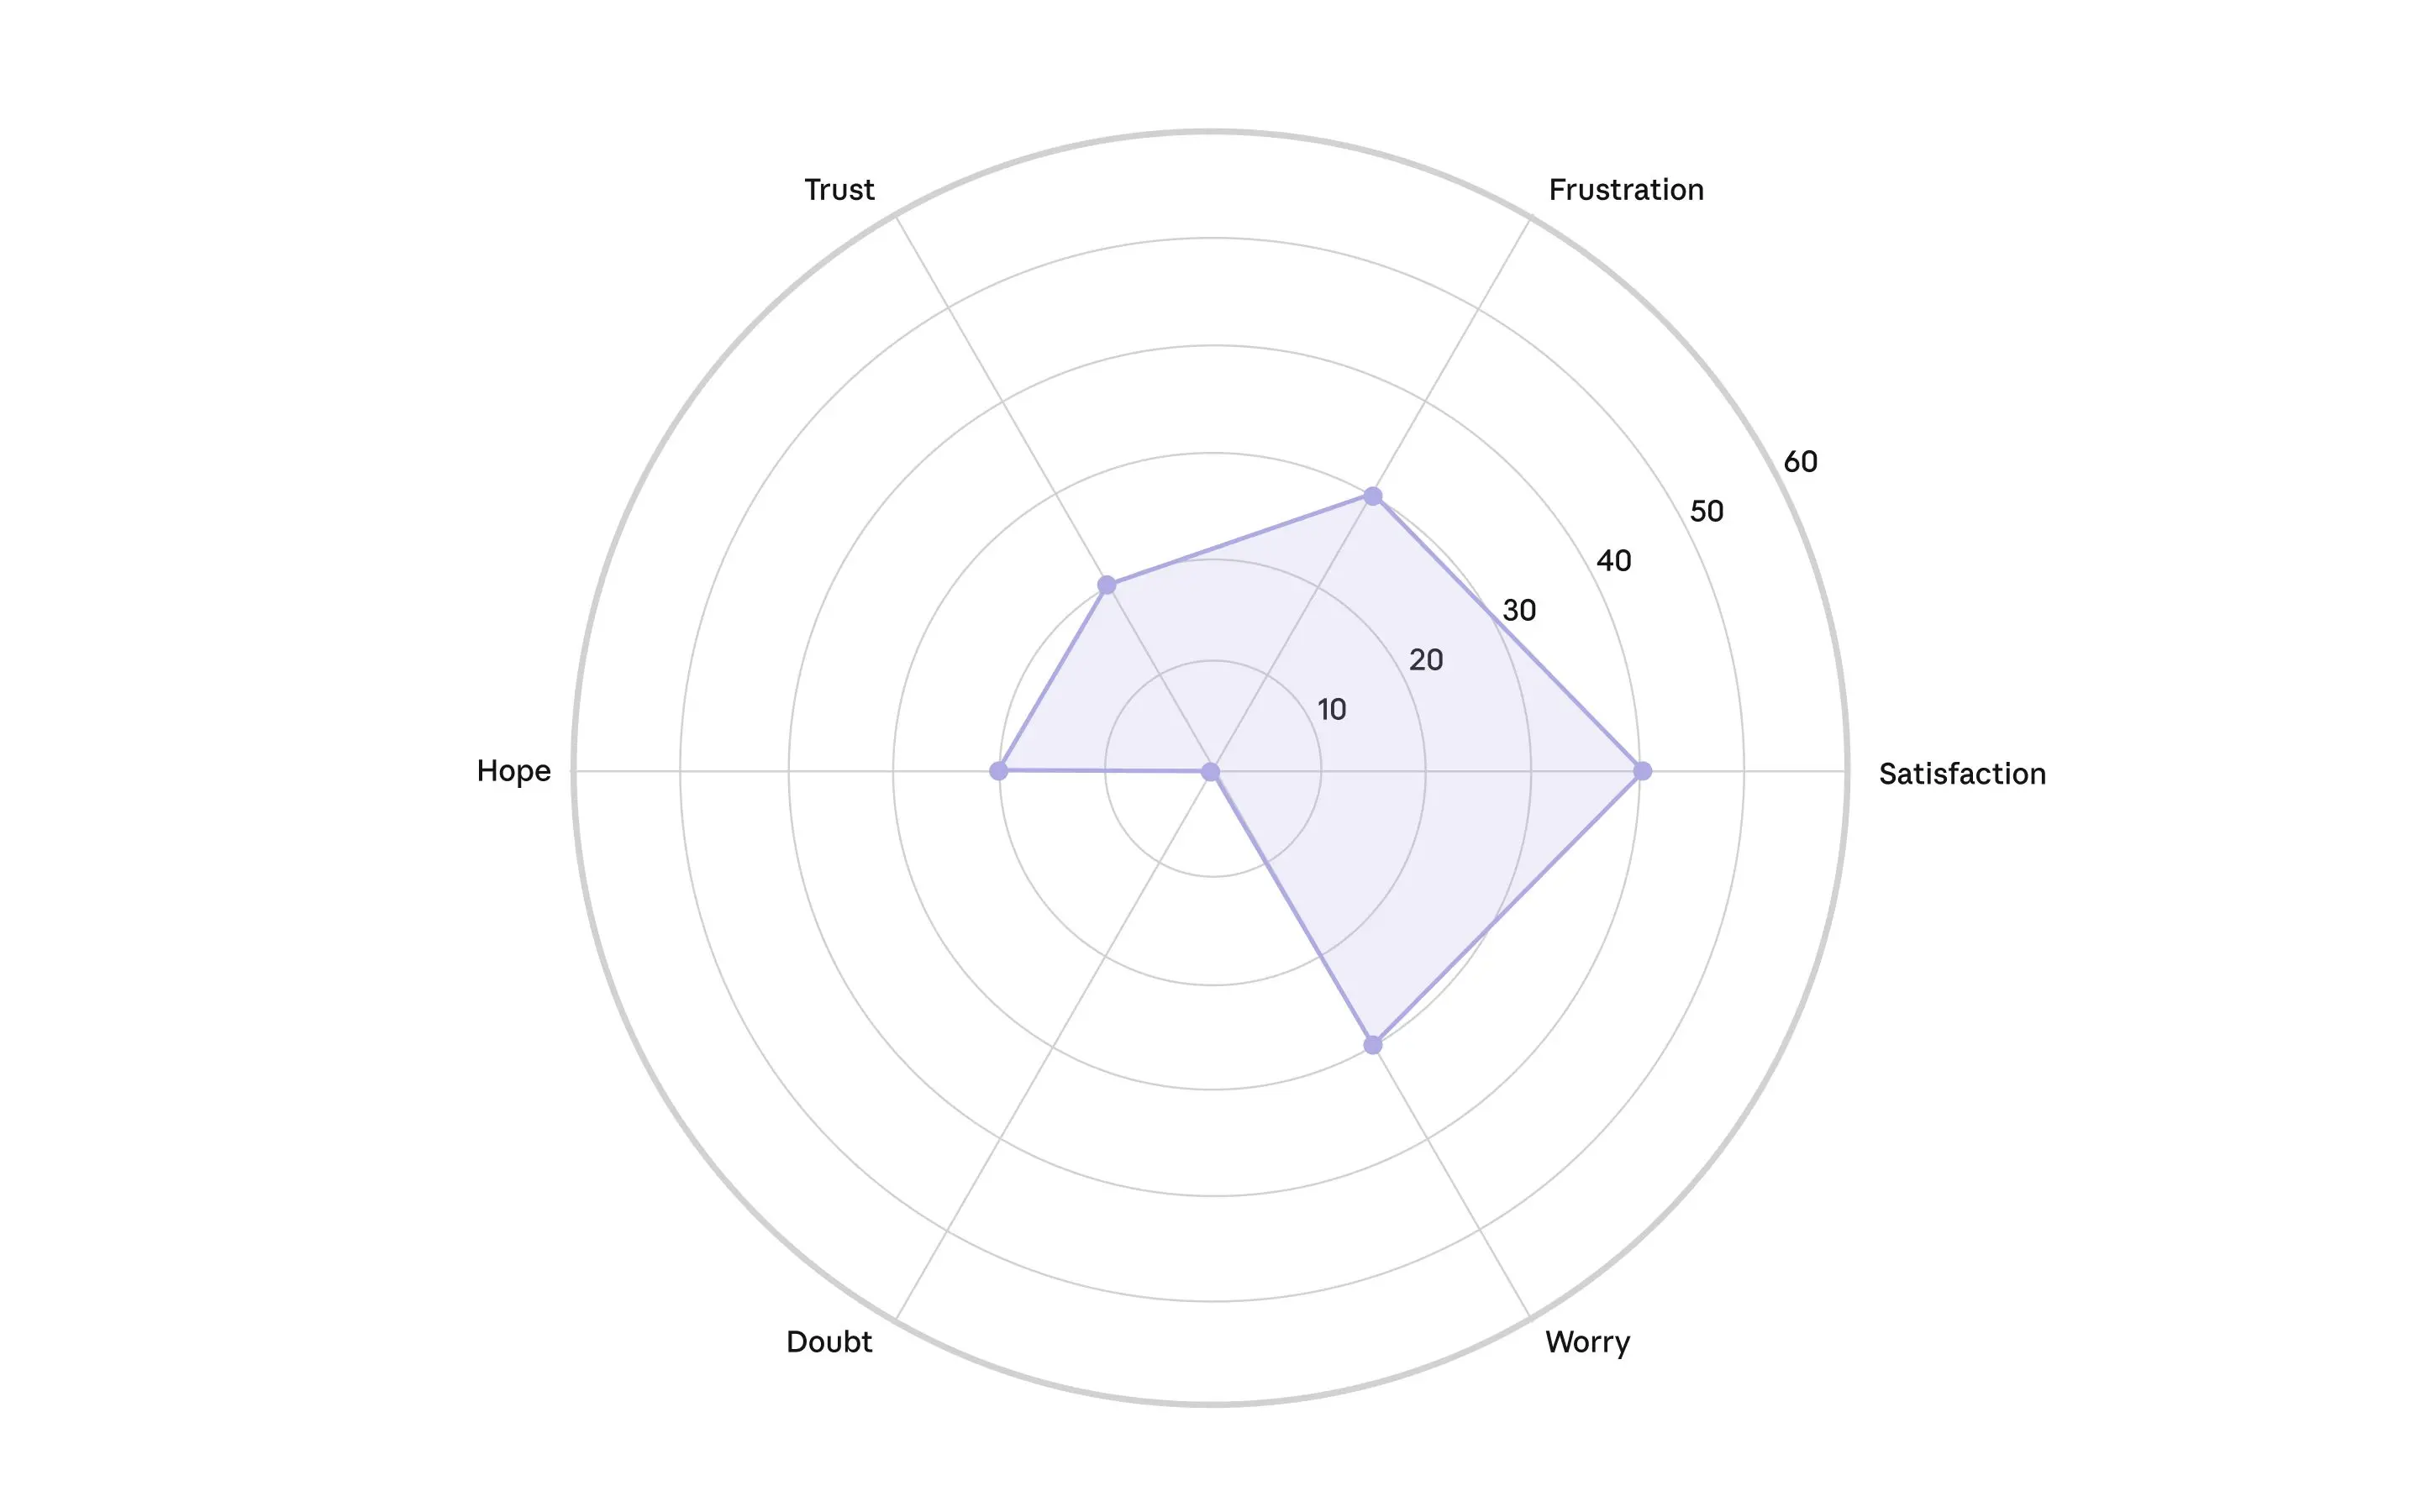
Intensity of the top six emotions—hope, satisfaction, frustration, worry, doubt, and trust—reported during interviews with scientists. The axis denotes the percentage of interviews in which the participant expressed the given emotion. We analyzed these emotions across the six most prominent scientific disciplines in our sample.Intensity of the top six emotions—hope, satisfaction, frustration, worry, doubt, and trust—reported during interviews with scientists. The axis denotes the percentage of interviews in which the participant expressed the given emotion. We analyzed these emotions across the six most prominent scientific disciplines in our sample.Intensity of the top six emotions—hope, satisfaction, frustration, worry, doubt, and trust—reported during interviews with scientists. The axis denotes the percentage of interviews in which the participant expressed the given emotion. We analyzed these emotions across the six most prominent scientific disciplines in our sample.Intensity of the top six emotions—hope, satisfaction, frustration, worry, doubt, and trust—reported during interviews with scientists. The axis denotes the percentage of interviews in which the participant expressed the given emotion. We analyzed these emotions across the six most prominent scientific disciplines in our sample.Intensity of the top six emotions—hope, satisfaction, frustration, worry, doubt, and trust—reported during interviews with scientists. The axis denotes the percentage of interviews in which the participant expressed the given emotion. We analyzed these emotions across the six most prominent scientific disciplines in our sample.Intensity of the top six emotions—hope, satisfaction, frustration, worry, doubt, and trust—reported during interviews with scientists. The axis denotes the percentage of interviews in which the participant expressed the given emotion. We analyzed these emotions across the six most prominent scientific disciplines in our sample.