Chatbot Analytics Guide | Best Analytics Tools for AI Chatbots
Практическое руководство по аналитике чат-ботов от основателя AI-агентства Dalai. Автор объясняет, зачем нужна аналитика (доказательство ROI, оптимизация, раннее обнаружение проблем) и как её настроить: определить KPI, собирать данные через API-блоки и инструменты вроде Voiceflow, Airtable и Intercom, регулярно пересматривать метрики. Описаны ключевые показатели — usage, качество (успешные ответы vs fallback, эскалации, фидбэк), темы и интенты, а также расчёт сэкономленного времени и денег. На реальном кейсе показано, как сбойный AI-классификатор маскировал рост ошибок: всплеск «успехов» оказался иллюзией, поэтому важно копать глубже метрик. Приведены рекомендации по визуализации (bar, line, pie, простые числа) и критерии выбора аналитической платформы.
If you're reading this, chances are you're already running a chatbot or seriously considering it. Whether you're improving customer support or streamlining everyday communication, one thing is clear: your chatbot's effectiveness heavily relies on chatbot analytics.
Если вы это читаете, скорее всего, вы уже используете чат-бот или серьёзно об этом задумываетесь. Улучшаете ли вы клиентскую поддержку или упрощаете повседневное общение — одно ясно: эффективность вашего чат-бота сильно зависит от аналитики.
Effective analytics will really transform the way you build and deploy chatbots. From my experience running the AI agency Dalai, I've seen firsthand how analytics help businesses measure, understand, and continuously refine their chatbot's performance. This allows you to pinpoint exactly where improvements are needed, plus, consistently tracking your chatbot's impact makes demonstrating things like ROI straightforward.
In this guide, we'll explore:
Грамотная аналитика по-настоящему меняет то, как вы создаёте и развёртываете чат-ботов. По опыту работы с AI-агентством Dalai я лично видел, как аналитика помогает бизнесу измерять, понимать и постоянно улучшать работу чат-бота. Это позволяет точно определить, что именно требует доработки, а постоянное отслеживание эффекта от чат-бота упрощает демонстрацию таких показателей, как ROI. В этом руководстве мы рассмотрим:
Почему аналитика чат-ботов важна. Пошаговое руководство по измерению производительности. Ключевые метрики для отслеживания. Продвинутые методы анализа с реальными примерами. Как выбрать подходящую аналитическую платформу. Практические советы по внедрению.
Why Chatbot Analytics Matter
Почему аналитика чат-ботов важна
Deploying a chatbot without analytics is like navigating the sea without a compass. Here’s why analytics matter:
Запускать чат-бот без аналитики — всё равно что плыть по морю без компаса. Вот почему аналитика важна:
Доказательство ROI: продемонстрируйте бизнес-ценность чат-бота через измеримую экономию времени и денег. Оптимизация производительности: понимайте, что работает, а что нужно улучшить. Раннее обнаружение проблем: ловите и исправляйте сбои до того, как они затронут пользователей.
Step-by-Step Guide to Measuring Performance
Пошаговое руководство по измерению производительности
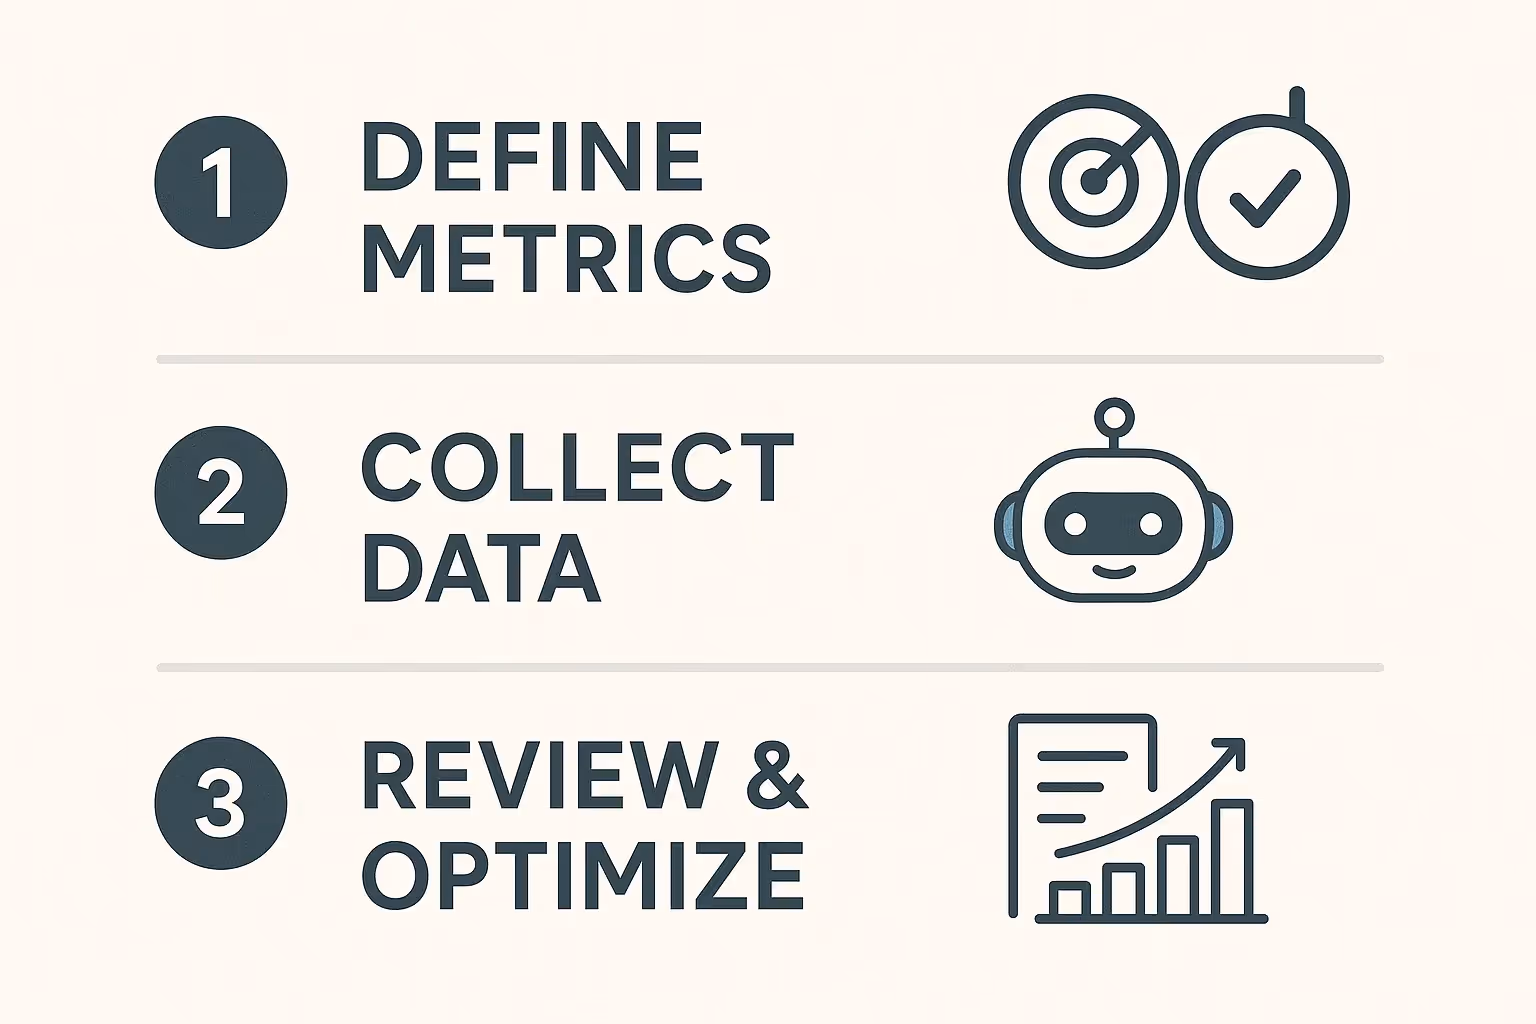
Setting up chatbot analytics isn't just about collecting data. It's about turning that data into insights you can act on. Here's how:
Настройка аналитики чат-бота — это не просто сбор данных. Это превращение этих данных в инсайты, на которые можно действовать. Вот как это делать:
1. Define Clear Metrics and KPIs to Track
1. Определите чёткие метрики и KPI для отслеживания
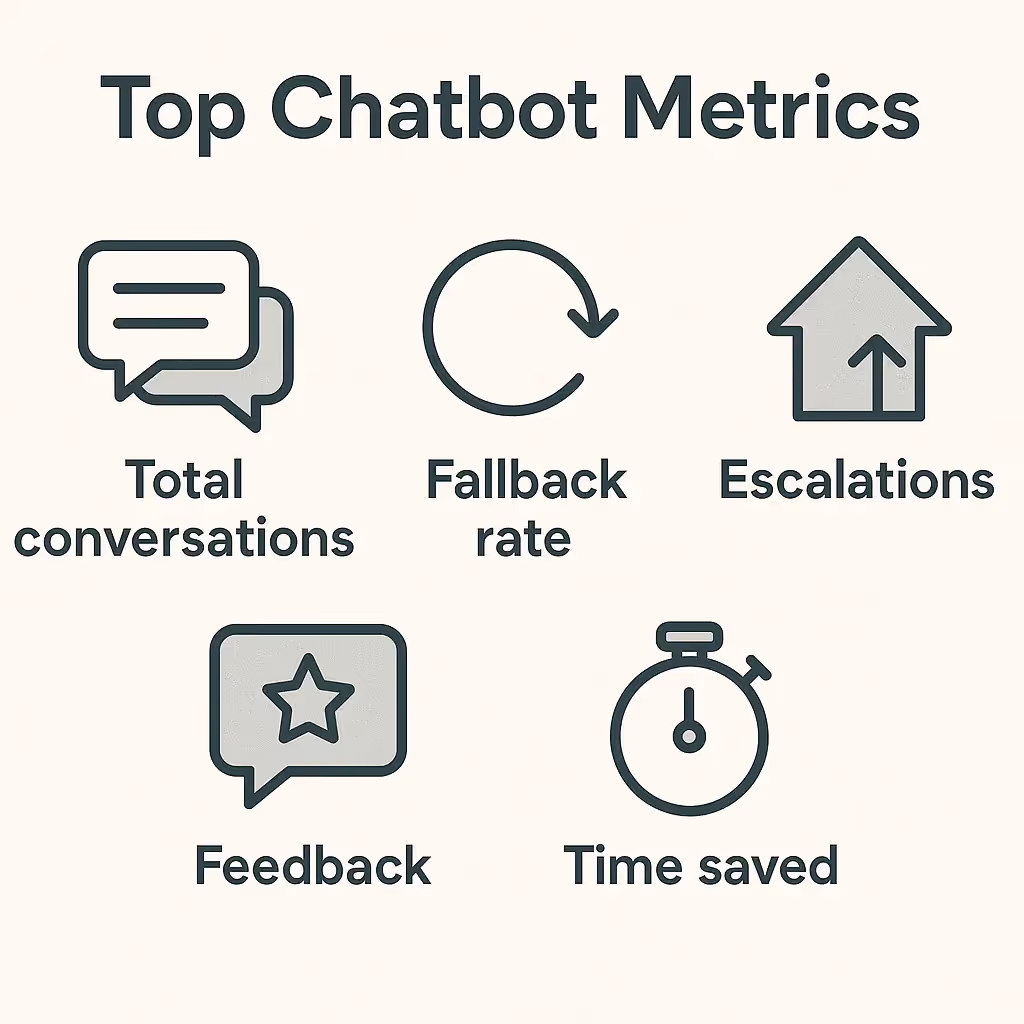
Your chatbot’s purpose drives what you measure. Ask yourself: are we trying to reduce human workload, improve answer quality, or justify investment? Once you’ve got clarity, choose metrics like:
То, что вы измеряете, определяется целью вашего чат-бота. Спросите себя: мы хотим сократить нагрузку на людей, повысить качество ответов или обосновать инвестиции? Когда определитесь, выбирайте метрики, такие как:
Доля fallback-ответов. Количество эскалаций. Успешные ответы. Пользовательский фидбэк. Экономия затрат.
2. Set Up Effective Data Collection
2. Настройте эффективный сбор данных
Platforms like Voiceflow or Intercom provide basics like message count, conversations, and user numbers from the API. But if you want deeper insight, you need to go further.
Платформы вроде Voiceflow или Intercom предоставляют базовые показатели через API — количество сообщений, разговоров и пользователей. Но если вам нужно более глубокое понимание, надо идти дальше.
You can use a button-step after AI responses to get user feedback
Add an AI step that classifies if the query was truly resolved. This gives you a clean success/failure metric.
Trigger an API call when a human takes over.
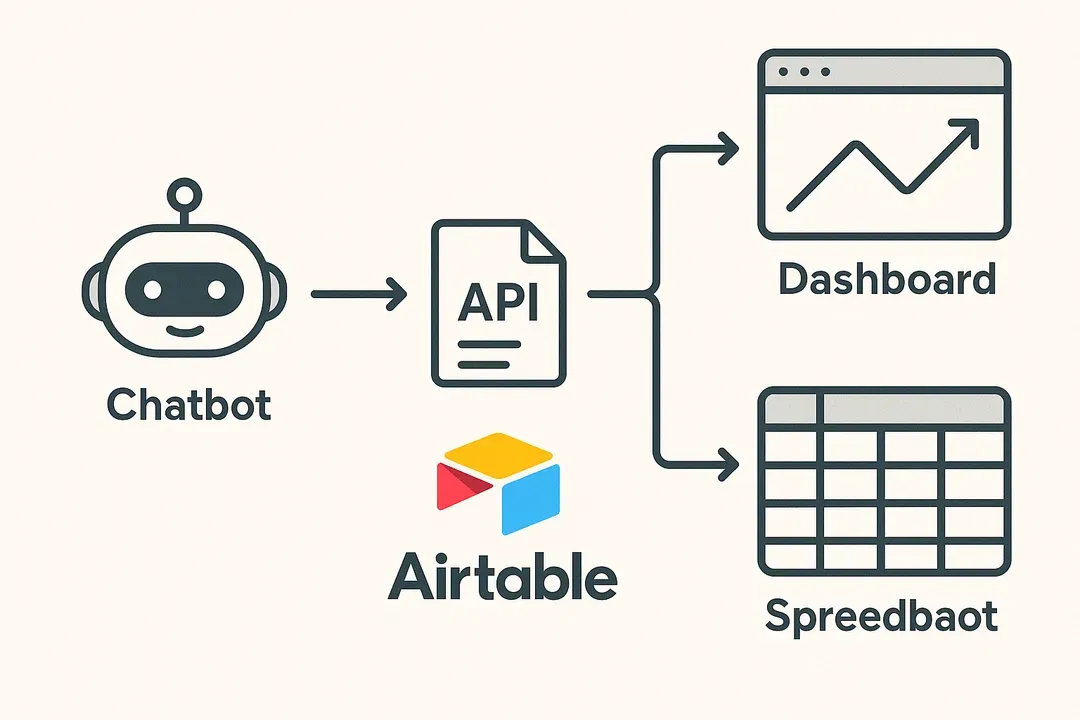
I use API blocks to send custom event data to an external database. This gives me total control over what I track.
My go-to tool? Airtable. It’s super intuitive, requires no code, and makes it easy to structure and store data like:
- Chatbot ID
- Timestamp
- Intent name
- User query
- Outcome (success or fallback)
- Feedback
Добавьте запросы на фидбэк. Используйте button-шаг после ответов AI, чтобы собрать обратную связь от пользователей. Используйте AI-классификацию. Добавьте AI-шаг, который определяет, был ли запрос действительно решён. Это даёт вам чёткую метрику успеха/неудачи. Логируйте эскалации вручную. Запускайте API-вызов, когда подключается человек. Отслеживайте эти метрики через API-блок. Я использую API-блоки для отправки кастомных данных о событиях во внешнюю базу. Это даёт мне полный контроль над тем, что я отслеживаю. Мой любимый инструмент? Airtable. Он очень интуитивен, не требует кода и позволяет легко структурировать и хранить такие данные, как: ID чат-бота, временная метка, имя интента, запрос пользователя, результат (успех или fallback), фидбэк.
Note: Not all data has to be logged in an external database. Most AI chatbot platforms let you fetch standard metrics from the API. For Voiceflow I use the API to fetch amount of conversations and messages as well as categories(based of intents).
Замечание: не все данные нужно логировать во внешнюю базу. Большинство платформ AI-чат-ботов позволяют получить стандартные метрики через API. Для Voiceflow я использую API для получения количества разговоров и сообщений, а также категорий (на основе интентов).
3. Regularly Review, Analyze, and Adjust
3. Регулярно пересматривайте, анализируйте и корректируйте
This isn’t a one-time setup. I recommend that you review metrics at least monthly. Look for patterns in fallbacks, drops in engagement, or strange behavior.
Это не разовая настройка. Рекомендую пересматривать метрики хотя бы раз в месяц. Ищите закономерности в fallback-ах, провалы вовлечённости или странное поведение.
Ask why things happened, then fix them. Data is only valuable if you use it to improve.
Спрашивайте, почему что-то произошло, и устраняйте причины. Данные ценны только тогда, когда вы используете их для улучшений.
Key Chatbot Metrics to Track Chatbot Performance
Ключевые метрики для отслеживания производительности чат-бота
Tracking the right metrics is where the real magic happens. Over the past years working with clients, I’ve learned that generic analytics dashboards often use the wrong metrics. To get truly actionable insights, you need to go deeper and focus on the right level of granularity.
Отслеживание правильных метрик — вот где случается настоящая магия. За годы работы с клиентами я понял, что типовые дашборды аналитики часто используют не те метрики. Чтобы получить действительно применимые инсайты, нужно копать глубже и фокусироваться на правильном уровне детализации.
Here’s what I always look at:
Вот на что я всегда смотрю:
Usage Metrics
Метрики использования
Всего сообщений: отлично подходит для оценки использования и затрат, но цифру могут раздуть пользователи, повторяющие вопросы — поэтому возможны естественные всплески. Всего разговоров: даёт более ясную картину реальных сессий. Одна сессия = один разговор, независимо от количества сообщений. Метрика всё же может быть раздута пользователями, которые запускают много сессий. Уникальные пользователи: показывает, сколько разных пользователей взаимодействовали с ботом за период. Самая стабильная из трёх метрик использования. Однако цифры здесь не такие впечатляющие. Не рекомендую завязывать инвестиционные расчёты вроде ROI на эту метрику, так как вы упустите сессии — у большинства пользователей бывает несколько разговоров.
Quality and Performance Metrics
Метрики качества и производительности
Успешные ответы vs. fallback-и: это соотношение помогает оценить работу бота. Высокая доля fallback-ов часто указывает на слабую базу знаний. Но будьте осторожны: то, что AI успешно ответил, не значит, что ответ был хорошим. Эскалированные разговоры: показывают, сколько чатов требуют помощи человека. Низкие цифры — хорошо, но контекст важен в зависимости от вашего сценария. Если цель — чтобы AI обрабатывал как можно больше вопросов и сокращал тикеты, важно отслеживать эскалации, чтобы видеть, насколько хорошо ваш чат-бот справляется с этим. Пользовательский фидбэк: будь то лайки, звёзды или быстрые вопросы вроде «Это было полезно?» — даже небольшого объёма обратной связи достаточно, чтобы выделить тренды. Рекомендую привязывать фидбэк напрямую к вопросу или интенту, после которого он был получен — так вы точно знаете, что нужно дорабатывать.
💡 Tip: I also like to follow up with users when they respond positively. Something like, “Glad that helped! Can you share what made it useful?” This small interaction often yields big insights.
💡 Совет: я также люблю продолжать диалог с пользователями, когда они отвечают положительно. Что-то вроде: «Рад, что это помогло! Можете поделиться, что именно оказалось полезным?» Такое небольшое взаимодействие часто даёт большие инсайты.
Topic and Intent Metrics
Метрики тем и интентов
Часто задаваемые темы: ваши топовые интенты показывают, где пользователи проводят больше всего времени. Это говорит вам, что оптимизировать или расширять в первую очередь, чтобы улучшить чат-бот там, где он используется активнее всего.
ROI Metrics
Метрики ROI
- If a chatbot saves 2 minutes per conversation…
- And a human agent earns $40/hour…
- Then every 30 conversations handled by the chatbot saves $40. The trick is personalization. Don’t use generic formulas. Let the user of the Analytics dashboard put in their hourly wage and the time they usually spend on handling conversations without the AI. That makes your monthly reports feel real and trustworthy. You can also set up advanced calculations using the other metrics shown above. What I do for my chatbots is also count conversations that were not handled properly and subtract that from the total amount saved. That leads to the most accurate results.
Сэкономленное время и деньги: это та метрика, которая больше всего волнует владельцев чат-ботов. Я считаю её так: если чат-бот экономит 2 минуты на разговор… и человек-агент зарабатывает $40/час… то каждые 30 разговоров, обработанных чат-ботом, экономят $40. Хитрость в персонализации. Не используйте общие формулы. Дайте пользователю аналитического дашборда возможность ввести свою почасовую ставку и время, которое он обычно тратит на обработку разговоров без AI. Это делает ваши ежемесячные отчёты реальными и заслуживающими доверия. Можно также настроить продвинутые расчёты с использованием других метрик, показанных выше. Что я делаю для своих чат-ботов — ещё и считаю разговоры, которые были обработаны некорректно, и вычитаю их из общей суммы экономии. Это даёт самые точные результаты.
Using Advanced Analytics: Real-World Insights
Использование продвинутой аналитики: инсайты из реальной жизни
Here’s a real example from one of my chatbots that shows why you can't just rely on surface-level metrics:
Вот реальный пример из работы с одним из моих чат-ботов, который показывает, почему нельзя полагаться только на поверхностные метрики:
We had just rolled out what we thought was a simple update to one of our client’s chatbot. Within hours, I noticed something that, at first glance, looked like great news: a huge spike in successful answers. It was the kind of graph you love to see. But something about it didn’t sit right with me. The jump was just too sudden, too clean.
Мы только что выкатили то, что казалось простым обновлением чат-бота одного клиента. В течение нескольких часов я заметил кое-что, что на первый взгляд выглядело отличной новостью: огромный всплеск успешных ответов. Это был такой график, который любишь видеть. Но что-то в нём меня смущало. Скачок был слишком резким, слишком чистым.
So I dug deeper. I compared the spike to the time of the update I had just rolled out and saw a perfect overlap. That made me suspicious. I started going through individual conversation logs, and what I found was concerning: the AI classifier that was supposed to decide whether the chatbot had successfully answered the user's question was malfunctioning. It was marking everything as a success, even when the user clearly didn’t get the help they needed.
Поэтому я копнул глубже. Я сравнил всплеск со временем только что выкаченного обновления и увидел идеальное совпадение. Это вызвало подозрения. Я начал просматривать логи отдельных разговоров и нашёл тревожную вещь: AI-классификатор, который должен был определять, успешно ли чат-бот ответил на вопрос пользователя, работал некорректно. Он помечал всё как успех, даже когда пользователь явно не получал нужной помощи.
In reality, the chatbot was failing more often than usual, not less. It was hallucinating to the user when it actually should have sent a fallback response. But if I had relied on the success metric alone, I would’ve completely missed it. Worse, I might have reported to the client that things were going better than ever. It was the trend graph, combined with curiosity and manual review, that saved us from weeks of user frustration and poor experiences.
На самом деле чат-бот ошибался чаще обычного, а не реже. Он галлюцинировал пользователю, когда должен был выдать fallback-ответ. Но если бы я полагался только на метрику успеха, я бы это полностью пропустил. Хуже того, я мог бы доложить клиенту, что дела идут лучше, чем когда-либо. Именно график тренда вкупе с любопытством и ручным разбором уберёг нас от недель пользовательской фрустрации и плохого опыта.
What I took from this: don’t assume that a metric going up is automatically good. You have to ask, why is this number changing? How is it calculated? And does it actually reflect what users are experiencing?
Что я из этого вынес: не считайте, что рост метрики — это автоматически хорошо. Нужно спрашивать: почему эта цифра меняется? Как она рассчитывается? И действительно ли она отражает то, что испытывают пользователи?
Visualizing Your Chatbot Data: Picking the Right Charts
Визуализация данных чат-бота: выбор правильных графиков
Now that you’ve got the metrics, how do you actually present them in a way people understand? Visualization is everything. The wrong chart can confuse your team or your client. The right one can make your insight click in a second.
Теперь, когда у вас есть метрики, как их подать так, чтобы люди поняли? Визуализация — это всё. Неправильный график может запутать вашу команду или клиента. Правильный — заставит инсайт «щёлкнуть» за секунду.
Here's a breakdown of the chart types I regularly use, when to use them, and what to avoid:
Вот разбор типов графиков, которые я регулярно использую, когда их применять и чего избегать:
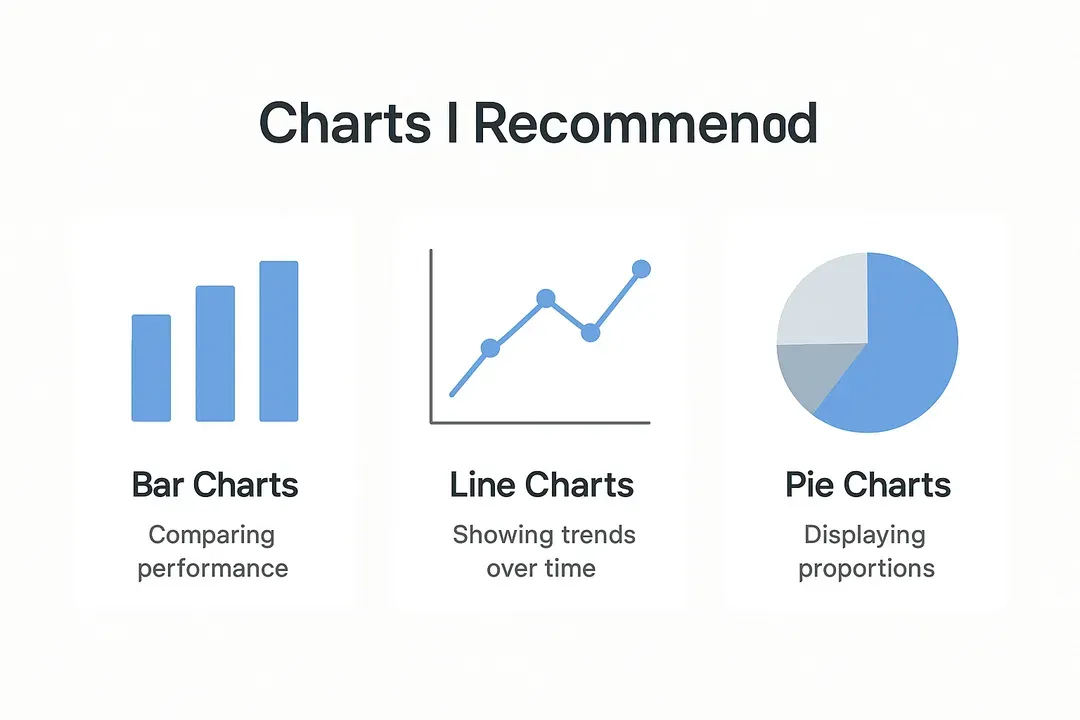
Charts I Recommend
Графики, которые я рекомендую
Столбчатые диаграммы (bar charts): отлично подходят для сравнения производительности по категориям — например, количества успешных ответов vs. fallback-ов. Они чистые, простые и сразу понятные. Линейные графики (line charts): отлично подходят для отслеживания трендов во времени. Я использую их, когда хочу показать, как улучшаются fallback-и от месяца к месяцу или как меняется объём пользователей в течение недели. Только обязательно чётко подписывайте временные интервалы. Круговые диаграммы (pie charts) — экономно: они подходят, когда нужно показать простую пропорцию, например, какой процент разговоров был успешным. Но если у вас больше 3-4 секторов, их быстро становится трудно читать. Простые числа: в дополнение к графикам всегда хорошая идея показать все метрики как простые числа.
Common Pitfalls to Avoid
Распространённые ошибки, которых стоит избегать
Усложнение визуалов: не используйте сложные 3D-графики или насыщенные цветовые градиенты. Они могут выглядеть круто, но часто скорее путают, чем помогают. Слишком много данных сразу: если попытаетесь показать 15 метрик на одном графике, никто не разберётся. Сохраняйте фокус и ясность. Вводящие в заблуждение оси: всегда начинайте ось Y с 0, если нет веской причины делать иначе. Иначе даже небольшие изменения будут выглядеть драматично и могут быть неправильно истолкованы. Забывать про подписи и единицы измерения: вы удивитесь, как часто это случается. Всегда подписывайте оси, указывайте единицы (минуты, проценты и т. д.) и показывайте временной диапазон. Игнорирование аудитории: график для команды разработки будет выглядеть иначе, чем тот, что вы отправляете маркетинг-менеджеру. Подстраивайте визуалы под того, кто их читает.
My Go-To Setup
Моя стандартная связка
For most client dashboards, I like to use:
Для большинства клиентских дашбордов я использую:
Линейные графики для производительности во времени. Столбчатые — для сравнений интентов и использования. Круговую диаграмму для обзора успех vs. fallback и лайки vs. дизлайки. Затем можно также показать сообщения, которые не были оценены. Например: 90% не оценены, 5% получили лайк, 5% — дизлайк. Простые числа я использую для всех метрик. Обычно размещаю их сверху.
That simple combo works in 90% of real-world cases. Keep it clean, explain what they’re looking at, and use visuals to guide smart decisions.
Эта простая связка работает в 90% реальных случаев. Держите всё чистым, объясняйте, на что люди смотрят, и используйте визуалы, чтобы направлять умные решения.
What to Look For in an Analytics Platform
На что обращать внимание при выборе аналитической платформы
Picking the right platform makes a big difference. Here’s what I look for:
Выбор правильной платформы имеет большое значение. Вот на что я смотрю:
Визуальные отчёты: вы должны понимать производительность с одного взгляда. Прозрачность: знайте, как именно рассчитываются ваши метрики. Кастомное отслеживание: у каждой команды свои цели. Платформа должна позволять отслеживать то, что важно именно вам. Данные в реальном времени: возможность видеть, что происходит прямо сейчас, помогает ловить проблемы рано. Интеграции: убедитесь, что она хорошо работает с инструментами, которые вы уже используете.
Practical Tips for Implementation
Практические советы по внедрению
Here are a few things I always keep in mind:
Вот несколько вещей, о которых я всегда помню:
Не оценивайте работу чат-бота по одной цифре. Метрики без контекста могут ввести в заблуждение, поэтому всегда анализируйте их в связке с общими целями чат-бота. Регулярно просматривайте логи fallback-ов. Они помогают понять, что идёт не так. Связывайте метрики с бизнес-ценностью. Так вы удерживаете внимание стейкхолдеров. Сочетайте фидбэк и производительность. Нужно и то и другое, чтобы получить полную картину. Тот факт, что чат-бот технически успешно ответил, не означает, что пользователь остался доволен результатом. Всегда копайте в фидбэк, чтобы понять полную картину.
One Final Tip
Последний совет
Send a short analytics summary every month to your team or client. Include usage numbers, fallback trends, top questions, and estimated ROI. It keeps everyone in the loop and reminds them the chatbot is doing real work.
Каждый месяц отправляйте своей команде или клиенту короткую аналитическую сводку. Включайте показатели использования, тренды fallback-ов, топовые вопросы и оценочный ROI. Это держит всех в курсе и напоминает, что чат-бот делает реальную работу.
Conclusion
Заключение
Here’s the bottom line: analytics aren’t just something you bolt on after launching a chatbot. They’re a core part of making your chatbot smarter, more helpful, and ultimately more valuable to your business.
Суть такая: аналитика — это не то, что прикручивают после запуска чат-бота. Это базовая часть того, что делает ваш чат-бот умнее, полезнее и в конечном счёте ценнее для бизнеса.
You should not just just review numbers, you should ask why those numbers matter, what they say about the user experience, and what needs to change.
Нужно не просто просматривать цифры, а спрашивать, почему эти цифры важны, что они говорят о пользовательском опыте и что нужно изменить.
So if you’re running a chatbot today, here’s what I’d recommend:
Так что если вы сегодня запускаете чат-бота, вот что я рекомендую:
Отслеживайте то, что важно, а не то, что проще всего измерить. Визуализируйте инсайты так, чтобы это было понятно живым людям. Фокусируйтесь на трендах, а не на отдельных цифрах. Относитесь к логам fallback-ов и эскалаций как к лучшим учителям. Отправляйте регулярные обновления, чтобы стейкхолдеры оставались вовлечёнными. Настройте кастомные метрики для своего чат-бота.
And that wraps up chatbot analytics in 2025.
И на этом мы заканчиваем разговор об аналитике чат-ботов в 2025.