
Labor market impacts of AI: A new measure and early evidence
Anthropic представила новую метрику воздействия AI на рынок труда — observed exposure, которая объединяет теоретические возможности LLM из работы Eloundou et al. (2023) с реальными данными использования из Anthropic Economic Index, придавая больший вес автоматизированным и рабочим сценариям. Авторы (Maxim Massenkoff и Peter McCrory) показывают, что фактическое покрытие задач AI пока далеко от теоретического потенциала: Claude покрывает лишь около 33% задач в категории Computer & Math. Наиболее подверженными оказались программисты (75% покрытия), специалисты по работе с клиентами и операторы ввода данных (67%); работники с высокой экспозицией чаще старше, женщины, образованнее и с более высокой зарплатой. BLS прогнозирует чуть более слабый рост занятости в подверженных профессиях: каждые 10 п.п. покрытия снижают прогноз на 0,6 п.п. С конца 2022 года систематического роста безработицы среди наиболее подверженных работников не обнаружено, однако есть слабые признаки замедления найма молодых работников (22–25 лет) в экспозированные профессии — снижение темпа найма примерно на 14%.
Labor market impacts of AI: A new measure and early evidence
Влияние AI на рынок труда: новая метрика и первые свидетельства

Key findings
Ключевые выводы
Мы вводим новую меру риска вытеснения работников из-за AI — observed exposure, которая объединяет теоретические возможности LLM и реальные данные использования, придавая больший вес автоматизированным (а не дополняющим) и связанным с работой сценариямAI пока далёк от достижения своего теоретического потенциала: фактическое покрытие остаётся лишь долей от возможногоПо прогнозам BLS, занятость в профессиях с более высокой observed exposure будет расти медленнее до 2034 годаРаботники в наиболее подверженных профессиях с большей вероятностью старше, женского пола, более образованные и с более высокой зарплатойМы не находим систематического роста безработицы среди сильно подверженных работников с конца 2022 года, однако есть косвенные свидетельства замедления найма молодых работников в подверженных профессиях
Introduction
Введение
The rapid diffusion of AI is generating a wave of research measuring and forecasting its impacts on labor markets. But the track record of past approaches gives reason for humility.
Быстрое распространение AI порождает волну исследований, измеряющих и прогнозирующих его влияние на рынок труда. Но опыт прошлых подходов даёт повод для скромности.
For example, a prominent attempt to measure job offshorability identified roughly a quarter of US jobs as vulnerable, but a decade on, most of those jobs maintained healthy employment growth. The government’s own occupational growth forecasts, while directionally correct, have added little predictive value beyond linear extrapolation of past trends. Even in hindsight, the impact of major economic disruptions on the labor market is often unclear. Studies on the employment effects of industrial robots reach opposing conclusions, and the scale of job losses attributed to the China trade shock continues to be debated.1
Например, одна заметная попытка измерить, какие рабочие места можно вынести за рубеж, отнесла примерно четверть рабочих мест в США к уязвимым, но десятилетие спустя в большинстве из них сохранился здоровый рост занятости. Государственные прогнозы роста занятости по профессиям, хотя и в целом верны по направлению, мало что добавили к линейной экстраполяции прошлых трендов в плане предсказательной силы. Даже задним числом влияние крупных экономических потрясений на рынок труда часто остаётся неясным. Исследования о влиянии промышленных роботов на занятость приходят к противоположным выводам, а масштаб потерь рабочих мест из-за торгового шока с Китаем по-прежнему остаётся предметом дискуссий.1
In this paper, we present a new framework for understanding AI’s labor market impacts, and test it against early data, finding limited evidence that AI has affected employment to date. Our goal is to establish an approach for measuring how AI is affecting employment, and to revisit these analyses periodically. This approach won't capture every channel through which AI could reshape the labor market, but by laying this groundwork now, before meaningful effects have emerged, we hope future findings will more reliably identify economic disruption than post-hoc analyses.
В этой работе мы представляем новую систему для понимания влияния AI на рынок труда и проверяем её на ранних данных, обнаруживая ограниченные свидетельства того, что AI к настоящему моменту повлиял на занятость. Наша цель — создать подход к измерению того, как AI влияет на занятость, и периодически возвращаться к этим анализам. Этот подход не охватит все каналы, через которые AI может изменить рынок труда, но, заложив этот фундамент сейчас, до того как проявятся значимые эффекты, мы надеемся, что будущие выводы будут надёжнее выявлять экономические потрясения, чем анализ постфактум.
It is possible that the impacts of AI will be unmistakable. This framework is most useful when the effects are ambiguous—and could help identify the most vulnerable jobs before displacement is visible.
Возможно, влияние AI окажется безошибочно очевидным. Эта система наиболее полезна тогда, когда эффекты неоднозначны, — и может помочь выявить наиболее уязвимые рабочие места ещё до того, как вытеснение станет заметным.
Counterfactuals
Контрфактуалы
Causal inference is easier when the effects are large and sudden. The COVID-19 pandemic and accompanying policy measures caused economic disruption so stark that sophisticated statistical approaches were unnecessary for many questions. For example, unemployment jumped sharply in the early weeks of the pandemic, leaving little room for alternative explanations.
Каузальный вывод проще, когда эффекты велики и внезапны. Пандемия COVID-19 и сопровождавшие её меры политики вызвали такие резкие экономические потрясения, что для многих вопросов сложные статистические подходы были не нужны. Например, безработица резко подскочила в первые недели пандемии, оставляя мало места для альтернативных объяснений.
The impacts of AI, however, might be less like COVID and more like the internet or trade with China. The effects may not be immediately clear from aggregate unemployment data; factors like trade policy and the business cycle could cloud interpretations of trend lines.
Однако влияние AI может быть менее похоже на COVID и больше — на интернет или торговлю с Китаем. Эффекты могут быть не сразу видны по агрегированным данным о безработице; такие факторы, как торговая политика и бизнес-цикл, могут затруднять интерпретацию трендов.
One common approach is to compare outcomes between more or less AI-exposed workers, firms, or industries, in order to isolate the effect of AI from confounding forces.2 Exposure is typically defined at the task level: AI can grade homework but not manage a classroom, for example, so teachers are considered less exposed than workers whose entire job can be performed remotely.
Один распространённый подход — сравнивать результаты между работниками, фирмами или отраслями с большей или меньшей подверженностью AI, чтобы выделить эффект AI из других возможных факторов.2 Подверженность обычно определяется на уровне задач: AI может проверять домашние работы, но не управлять классом, например, поэтому учителя считаются менее подверженными, чем работники, чья работа полностью может выполняться удалённо.
Our work follows this task-based approach, incorporating measures of theoretical AI capability and real-world usage, before aggregating to occupations.3
Наша работа следует этому подходу, основанному на задачах, объединяя меры теоретических возможностей AI и реального использования, с последующим агрегированием до уровня профессий.3
Measuring exposure
Измерение подверженности
Our approach combines data from three sources.
Наш подход объединяет данные из трёх источников.
База данных O*NET, в которой перечислены задачи примерно для 800 уникальных профессий в США.Наши собственные данные об использовании (измеренные в Anthropic Economic Index).Оценки подверженности на уровне задач из работы Eloundou et al. (2023), которые показывают, теоретически ли возможно для LLM ускорить выполнение задачи как минимум вдвое.
Eloundou et al.’s metric, β, scores tasks on a simple scale: 1 if a task can be doubled in speed by an LLM alone, 0.5 if it requires additional tools or software built on top of the LLM, and 0 otherwise.4
Метрика β из работы Eloundou et al. оценивает задачи по простой шкале: 1, если задачу можно ускорить вдвое одной только LLM; 0,5, если требуются дополнительные инструменты или ПО поверх LLM; и 0 в противном случае.4
Why might actual usage fall short of theoretical capability? Some tasks that are theoretically possible may not show up in usage because of model limitations. Others may be slow to diffuse due to legal constraints, specific software requirements, human verification steps, or other hurdles. For example, Eloundou et al. mark “Authorize drug refills and provide prescription information to pharmacies” as fully exposed (β=1). We have not observed Claude performing this task, although the assessment seems correct in that it could theoretically be sped up by an LLM.
Почему фактическое использование может отставать от теоретических возможностей? Некоторые теоретически возможные задачи могут не появляться в данных использования из-за ограничений модели. Другие могут медленно распространяться из-за юридических ограничений, требований к конкретному ПО, этапов человеческой проверки или других препятствий. Например, Eloundou et al. отмечают «Авторизация повторной выписки лекарств и предоставление информации о рецептах аптекам» как полностью подверженную (β=1). Мы не наблюдали, чтобы Claude выполнял такую задачу, хотя оценка кажется верной в том смысле, что теоретически её можно было бы ускорить с помощью LLM.
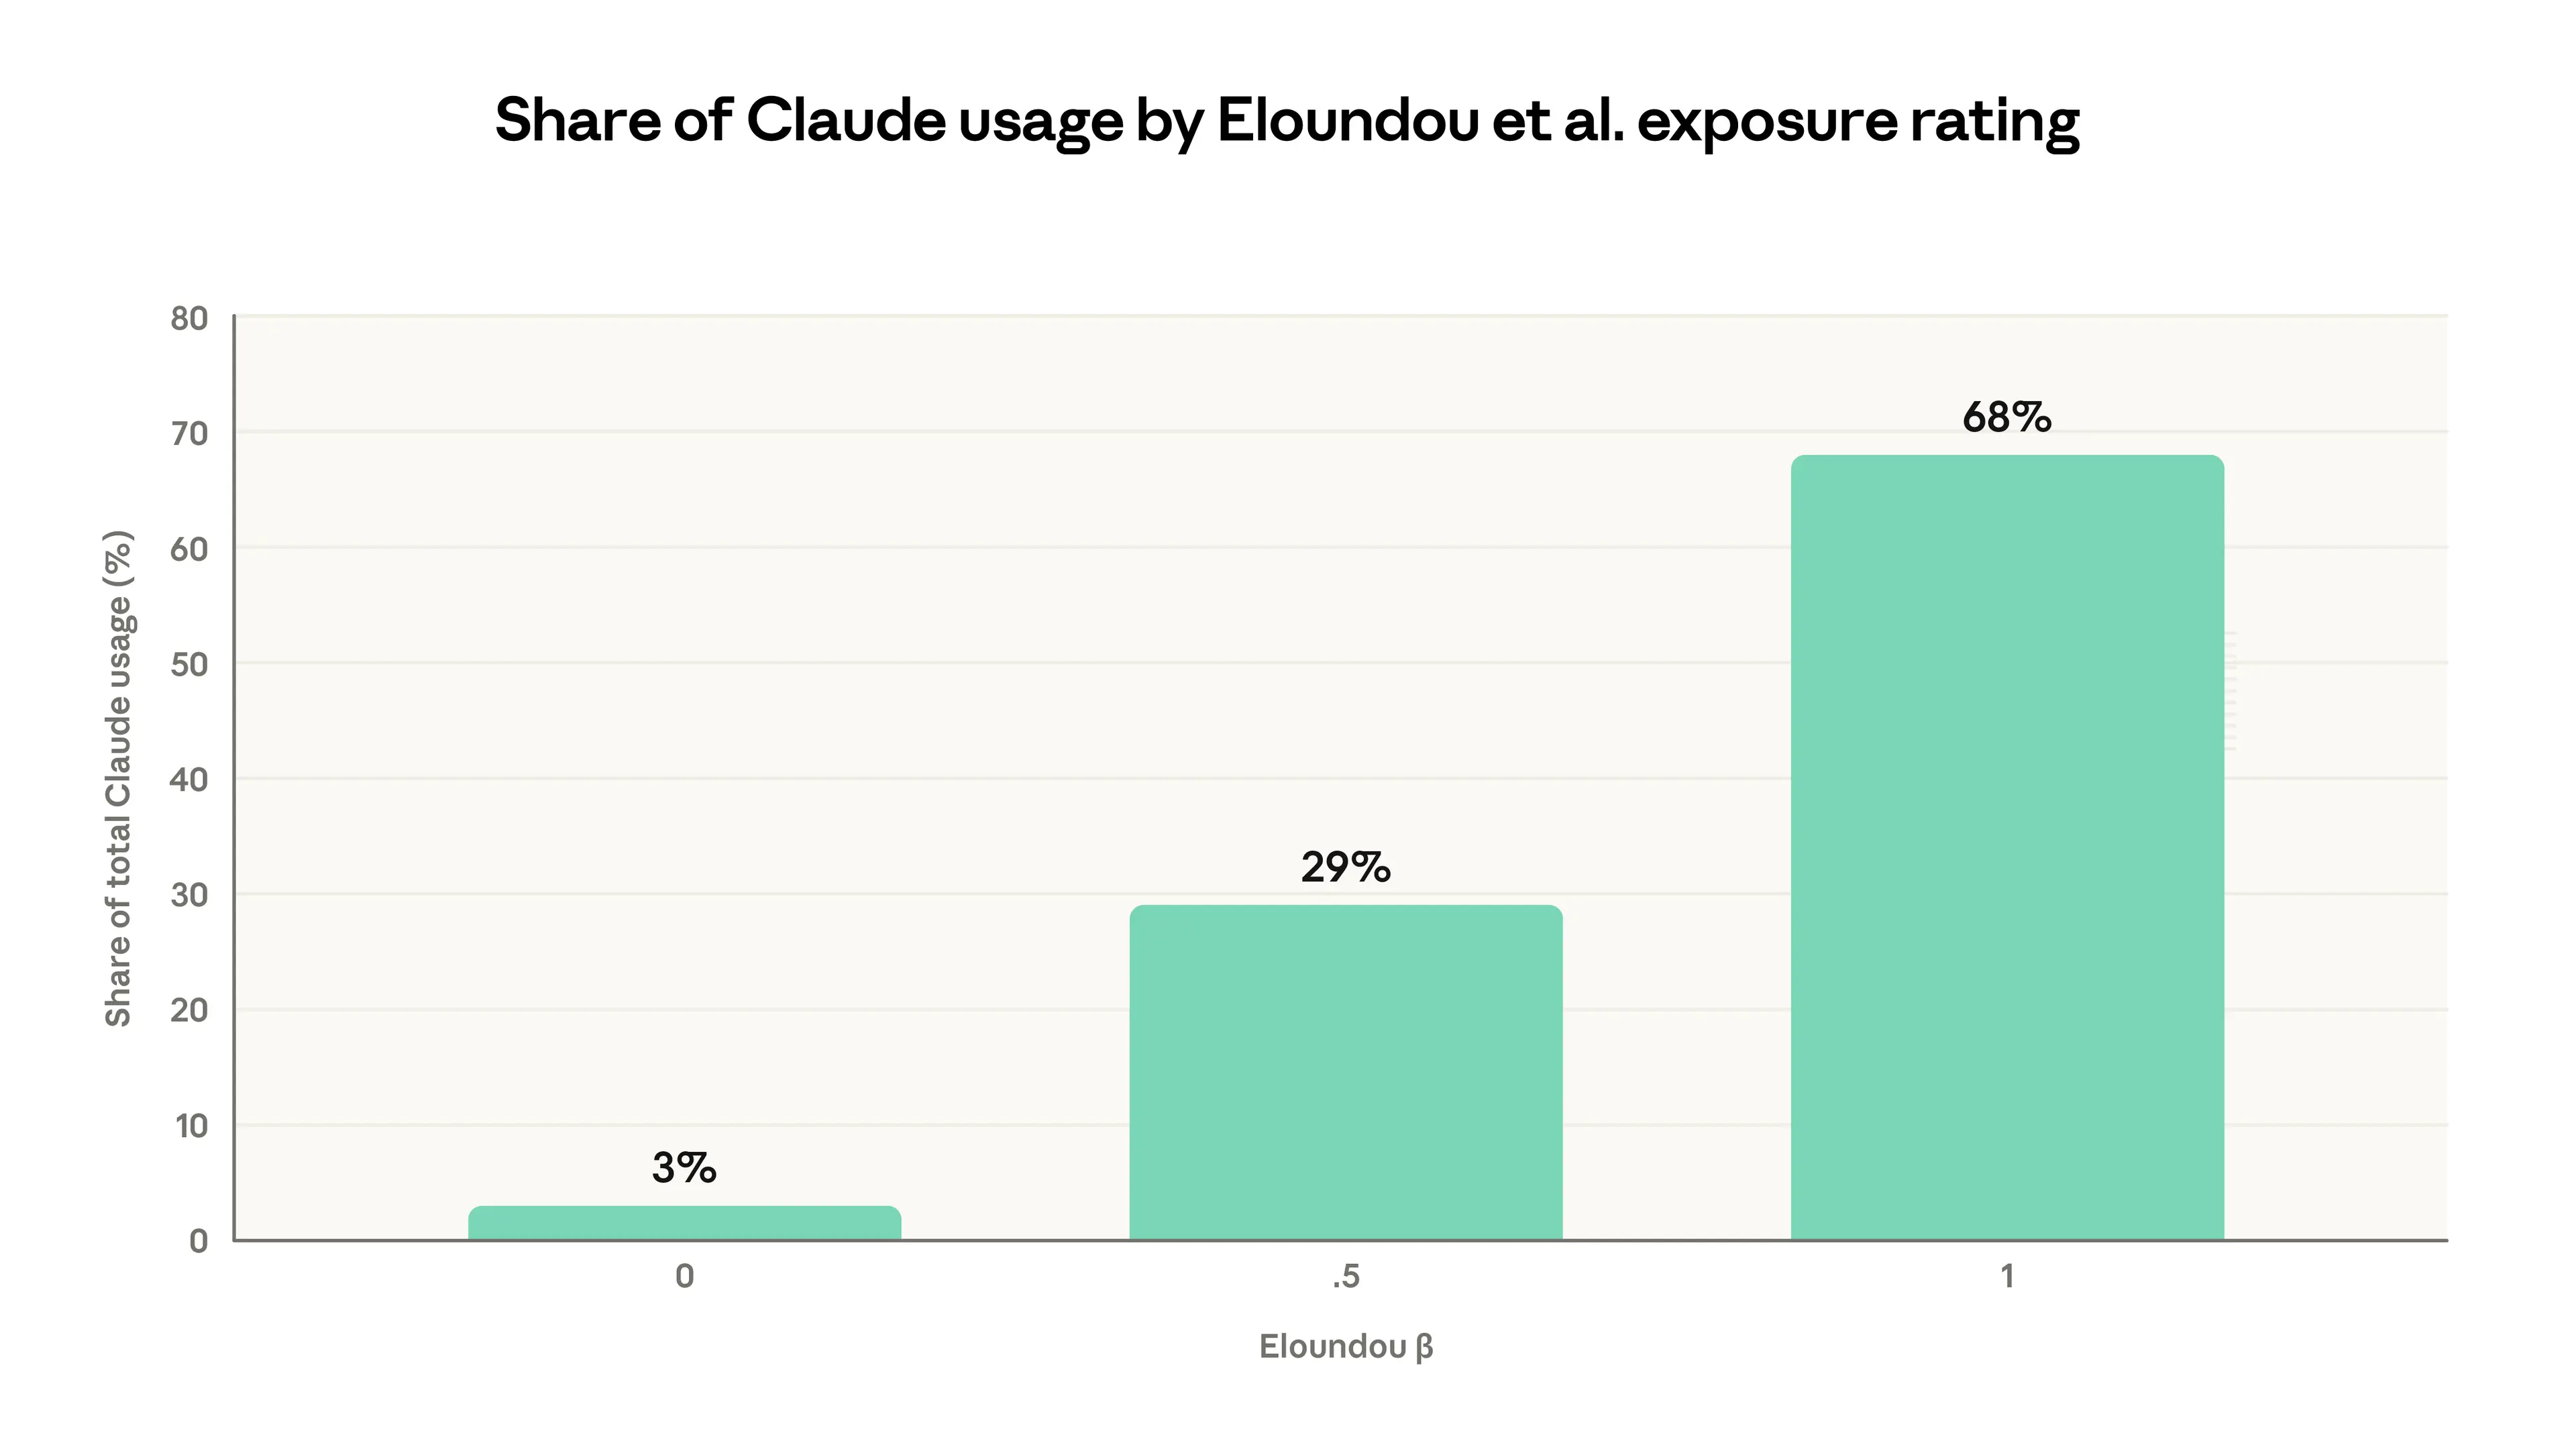
That said, these measures of theoretical capability and actual usage are highly correlated. As Figure 1 shows, 97% of the tasks observed across the previous four Economic Index reports fall into categories rated as theoretically feasible by Eloundou et al. (β=0.5 or β=1.0).
При этом меры теоретических возможностей и фактического использования сильно коррелируют. Как показано на Рисунке 1, 97% задач, наблюдаемых в четырёх предыдущих отчётах Economic Index, попадают в категории, оценённые Eloundou et al. как теоретически осуществимые (β=0,5 или β=1,0).
A new measure of occupational exposure
Новая мера подверженности на уровне профессий
Our new measure, observed exposure, is meant to quantify: of those tasks that LLMs could theoretically speed up, which are actually seeing automated usage in professional settings? Theoretical capability encompasses a much broader range of tasks. By tracking how that gap narrows, observed exposure provides insight into economic changes as they emerge.
Наша новая мера, observed exposure, призвана количественно оценить: из тех задач, которые LLM теоретически могли бы ускорить, какие действительно автоматизированно используются в профессиональных условиях? Теоретические возможности охватывают гораздо более широкий круг задач. Отслеживая, как этот разрыв сужается, observed exposure даёт представление об экономических изменениях по мере их появления.
Our measure qualitatively captures several aspects of AI usage that we think are predictive of job impacts. A job's exposure is higher if:
Наша мера качественно фиксирует несколько аспектов использования AI, которые, как мы считаем, предсказывают влияние на рабочие места. Подверженность работы выше, если:
Её задачи теоретически возможны с AIЕё задачи имеют значительное использование в Anthropic Economic Index5Её задачи выполняются в рабочих контекстахУ неё относительно более высокая доля автоматизированных сценариев использования или применений API.Затронутые AI задачи составляют большую долю общей роли6
We give mathematical details in the Appendix. We count tasks that are theoretically capable with an LLM as covered if they have seen sufficient work-related usage in Claude traffic. We then adjust for how the task is being carried out: fully automated implementations receive full weight, while augmentative use receives half weight. Finally, the task-level coverage measures are averaged to the occupation level weighted by the fraction of time spent on each task.
Математические детали приведены в Приложении. Мы считаем задачи, теоретически осуществимые с LLM, охваченными, если в трафике Claude они имели достаточное использование, связанное с работой. Затем мы корректируем на то, как именно выполняется задача: полностью автоматизированные сценарии получают полный вес, а дополняющее использование — половинный. Наконец, меры покрытия на уровне задач усредняются до уровня профессии с весом по доле времени, проводимого за каждой задачей.
Figure 2 shows observed exposure (in red) compared to β from Eloundou et al. (in blue), illustrating the difference between theoretical and actual use on our platform, grouped by broad occupational categories. We calculate this by first averaging to the occupation level weighting by our time fraction measure, then averaging to the occupation category weighting by total employment. For example, the β measure shows scope for LLM penetration in the majority of tasks in Computer & Math (94%) and Office & Admin (90%) occupations.
Рисунок 2 показывает observed exposure (красным) в сравнении с β из Eloundou et al. (синим), иллюстрируя разницу между теоретическим и реальным использованием на нашей платформе, сгруппированную по широким категориям профессий. Мы рассчитываем это, сначала усредняя до уровня профессии с весом по нашей мере доли времени, а затем усредняя до категории профессий с весом по общей занятости. Например, мера β показывает потенциал для проникновения LLM в большинстве задач профессий Computer & Math (94%) и Office & Admin (90%).
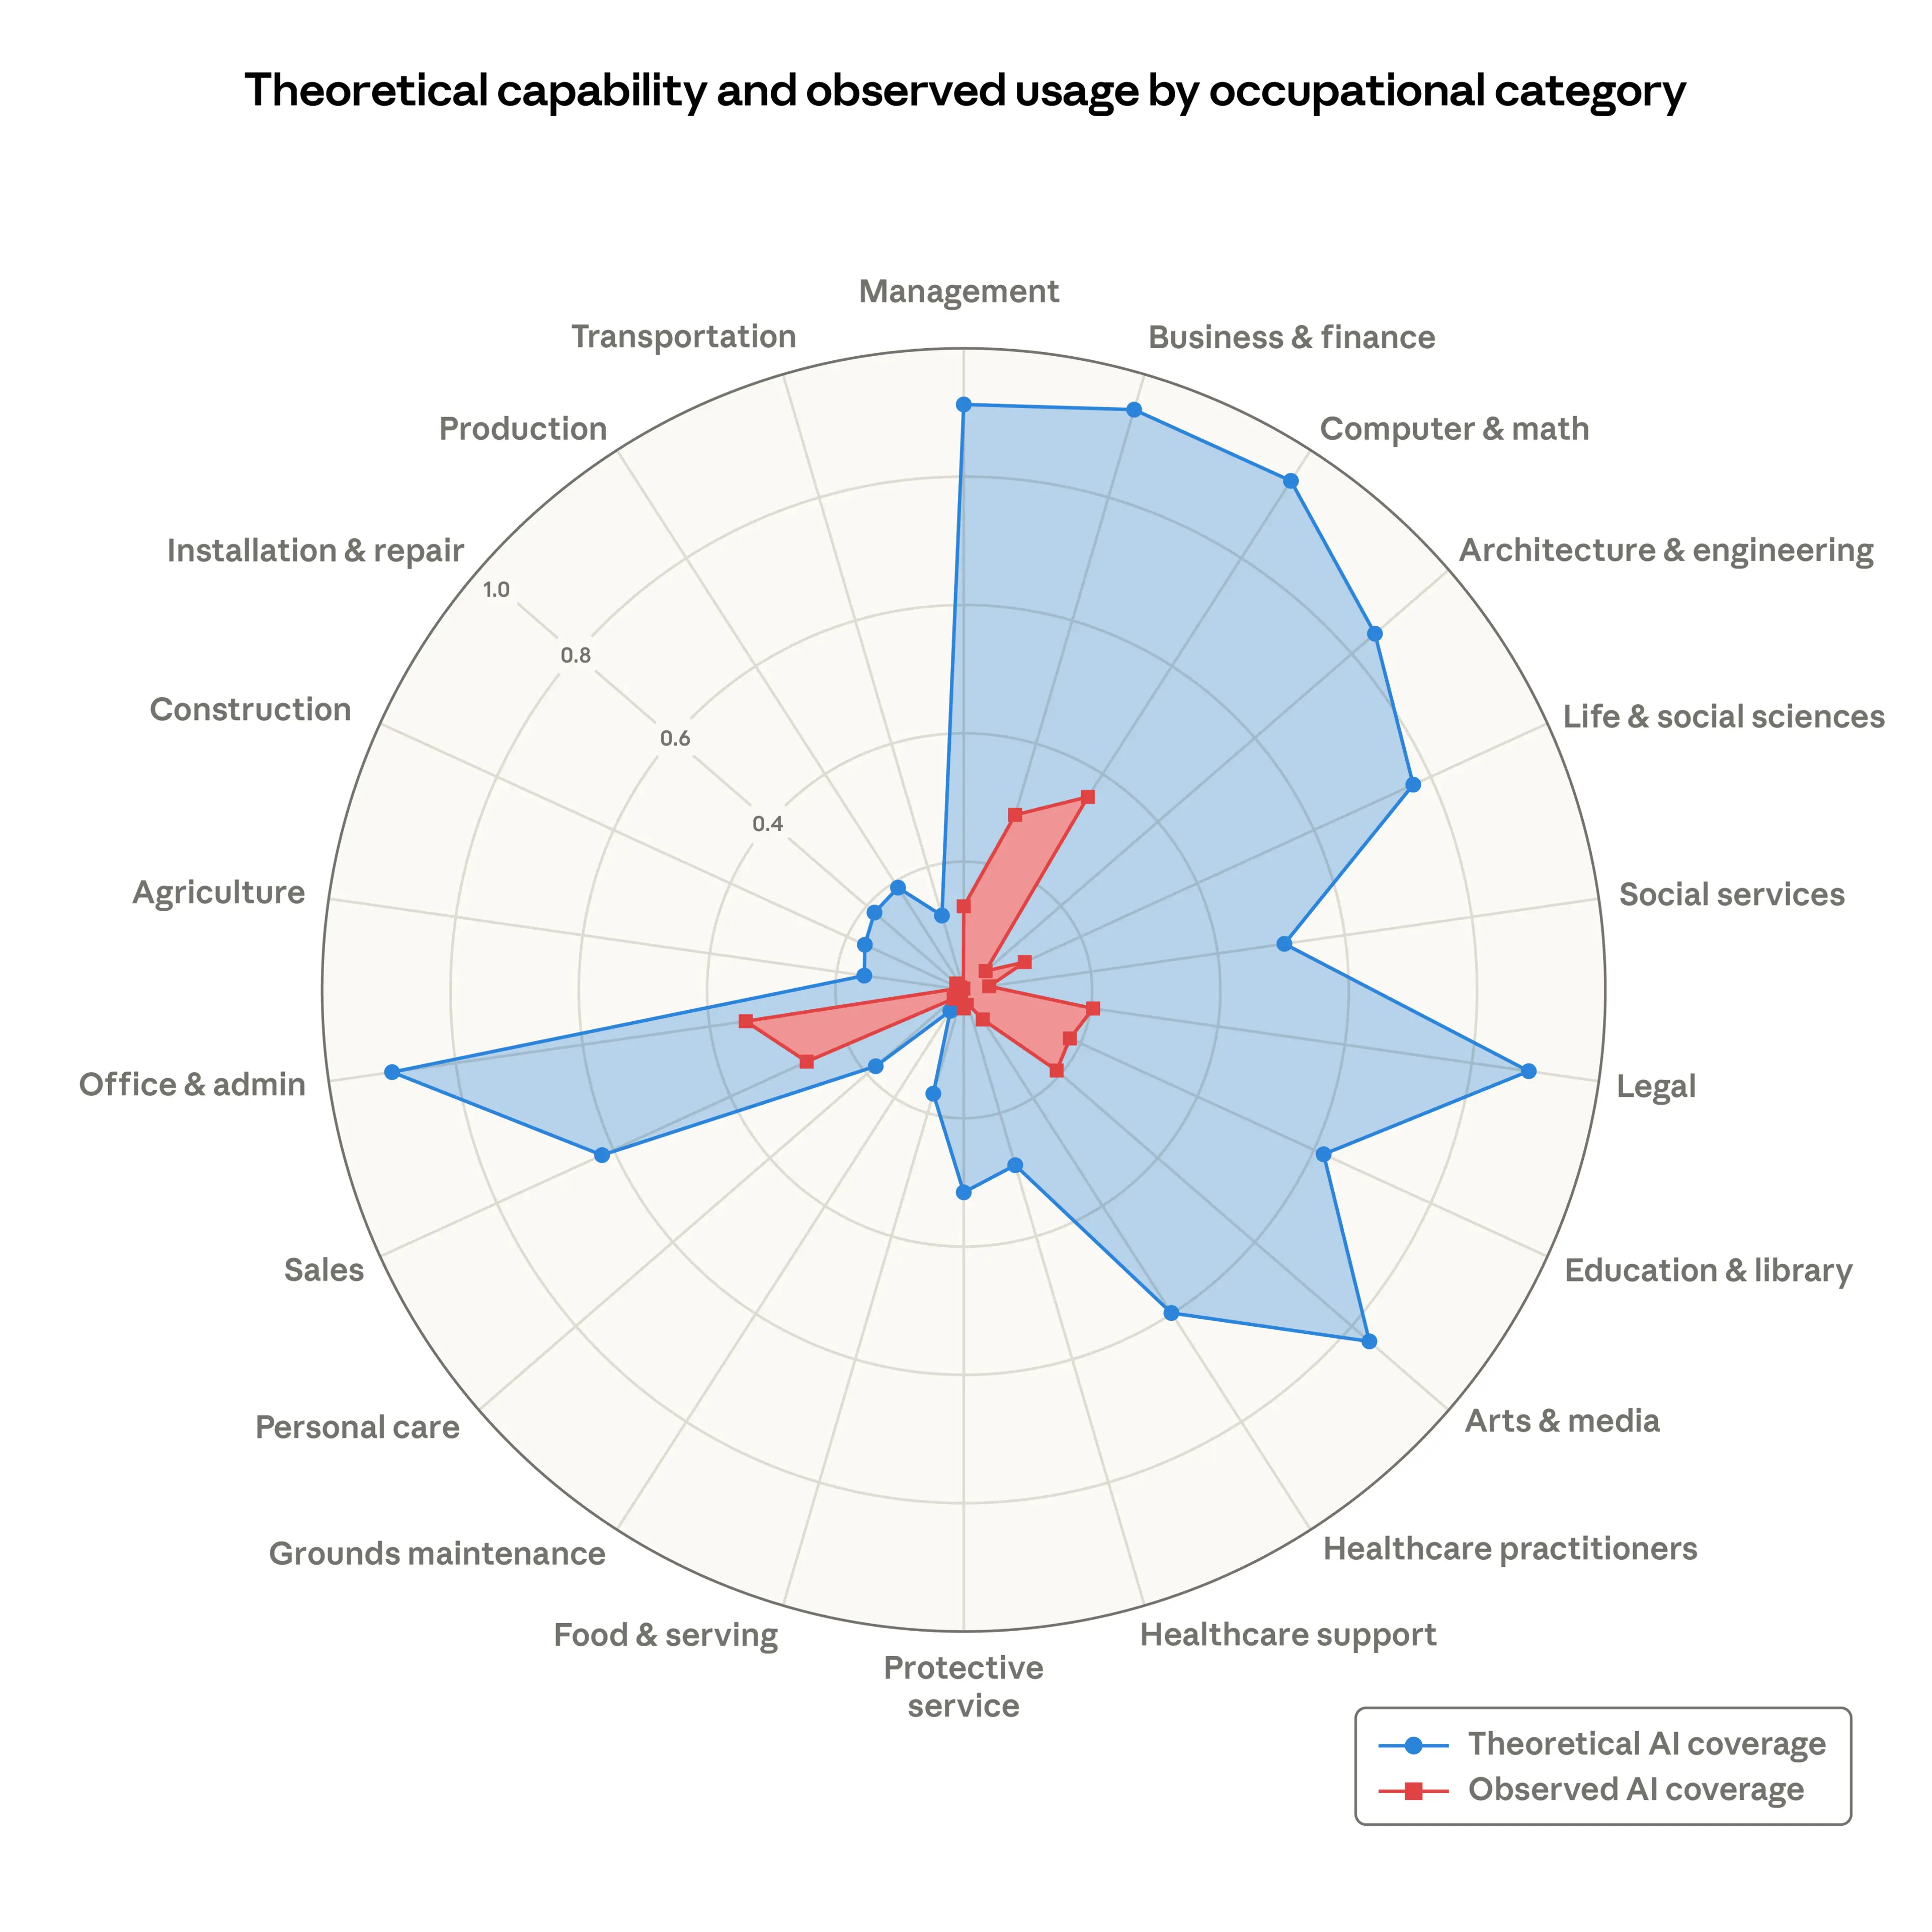
The red area, depicting LLM use from the Anthropic Economic Index, shows how people are using Claude in professional settings. The coverage shows AI is far from reaching its theoretical capabilities. For instance, Claude currently covers just 33% of all tasks in the Computer & Math category.
Красная область, отображающая использование LLM из Anthropic Economic Index, показывает, как люди используют Claude в профессиональной среде. Покрытие показывает, что AI пока далёк от достижения своих теоретических возможностей. Например, Claude в настоящее время охватывает лишь 33% всех задач в категории Computer & Math.
As capabilities advance, adoption spreads, and deployment deepens, the red area will grow to cover the blue. There is a large uncovered area too; many tasks, of course, remain beyond AI's reach—from physical agricultural work like pruning trees and operating farm machinery to legal tasks like representing clients in court.
По мере того как развиваются возможности, распространяется внедрение и углубляется развёртывание, красная область будет расширяться, покрывая синюю. Также есть большая непокрытая область; многие задачи, конечно, остаются вне досягаемости AI — от физической сельскохозяйственной работы вроде обрезки деревьев и управления сельхозтехникой до юридических задач вроде представления клиентов в суде.
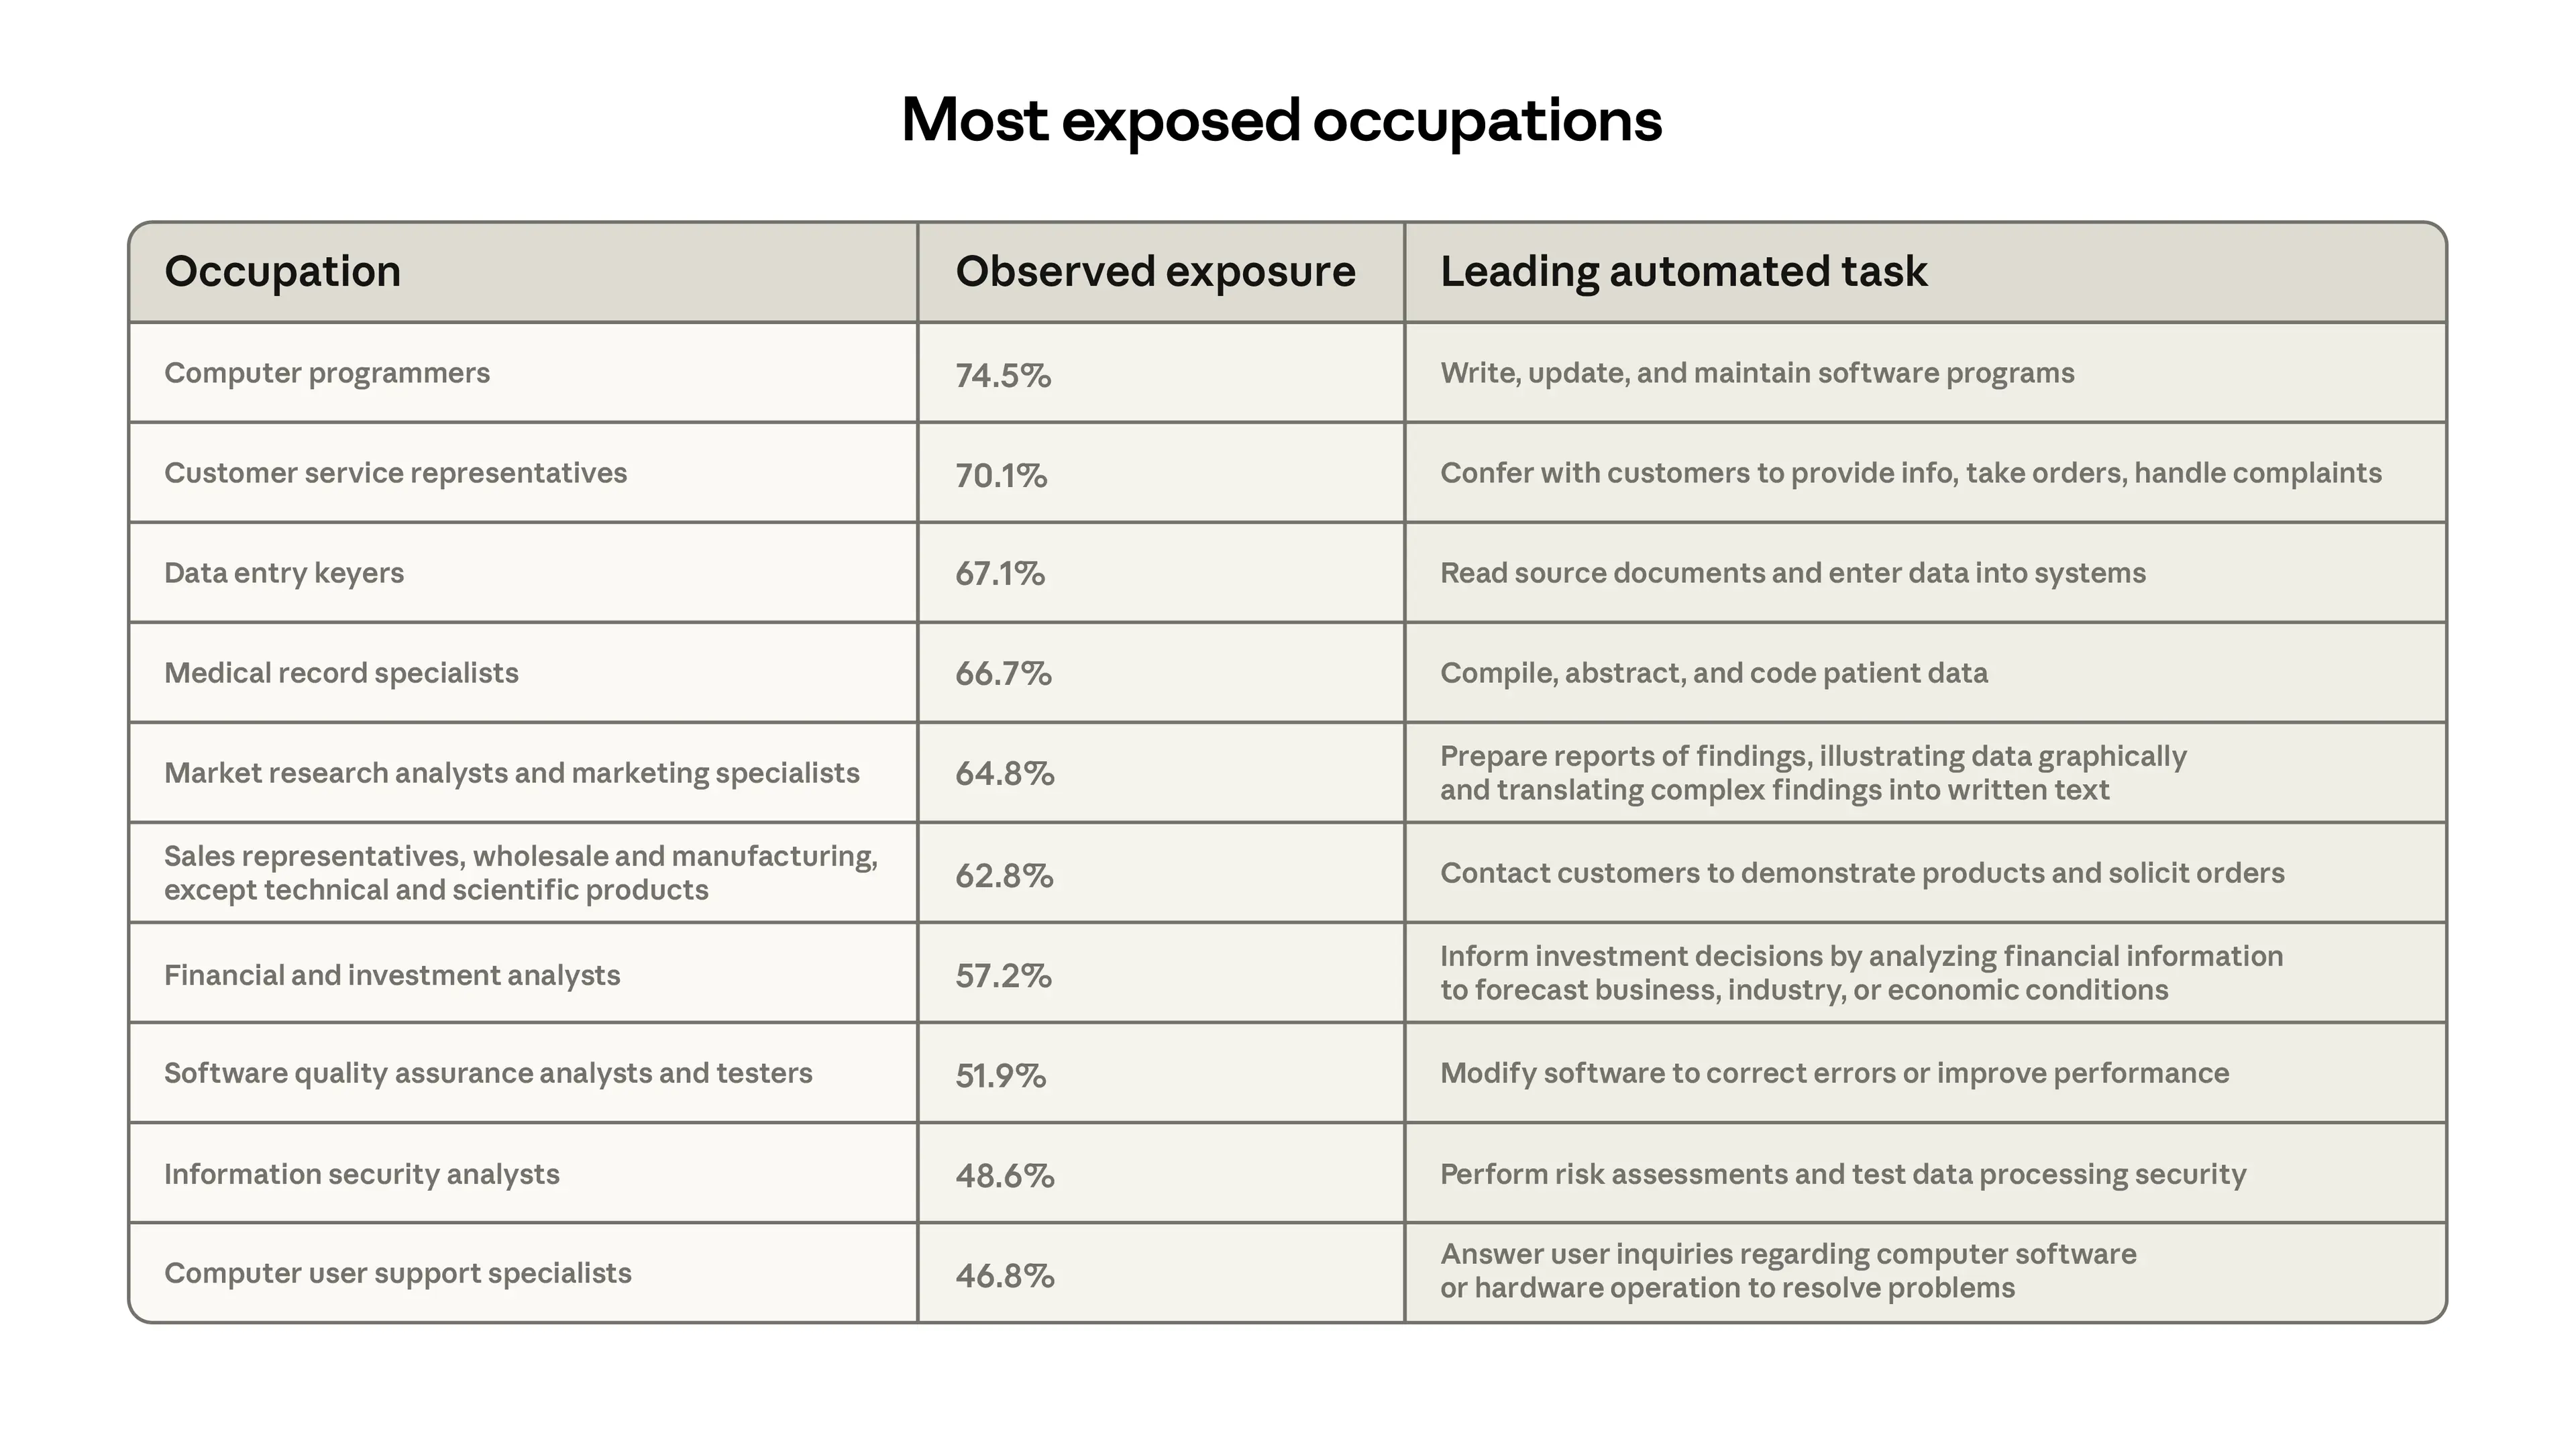
Figure 3 shows the ten occupations most exposed under this measure. In line with other data showing that Claude is extensively used for coding, Computer Programmers are at the top, with 75% coverage, followed by Customer Service Representatives, whose main tasks we increasingly see in first-party API traffic. Finally, Data Entry Keyers, whose primary task of reading source documents and entering data sees significant automation, are 67% covered.
Рисунок 3 показывает десять профессий, наиболее подверженных по этой мере. В соответствии с другими данными о том, что Claude активно используется для программирования, Computer Programmers находятся на вершине с покрытием 75%, за ними следуют Customer Service Representatives, чьи основные задачи мы всё чаще наблюдаем в трафике first-party API. Наконец, Data Entry Keyers, чья основная задача — чтение исходных документов и ввод данных — в значительной мере автоматизируется, покрыты на 67%.
At the bottom end, 30% of workers have zero coverage, as their tasks appeared too infrequently in our data to meet the minimum threshold. This group includes, for example, Cooks, Motorcycle Mechanics, Lifeguards, Bartenders, Dishwashers, and Dressing Room Attendants.
На нижнем конце 30% работников имеют нулевое покрытие, поскольку их задачи появлялись в наших данных слишком редко, чтобы преодолеть минимальный порог. В эту группу входят, например, повара, мотомеханики, спасатели, бармены, посудомойщики и работники гардеробов.
How exposure tracks with projected job growth and worker characteristics
Как подверженность связана с прогнозируемым ростом занятости и характеристиками работников
The US Bureau of Labor Statistics (BLS) publishes regular employment projections, with the latest set, published in 2025, covering predicted changes in employment for every occupation from 2024 to 2034. In Figure 4, we compare our job-level coverage measure to their predictions.
Бюро статистики труда США (BLS) регулярно публикует прогнозы занятости, и последний набор, опубликованный в 2025 году, охватывает прогнозируемые изменения занятости для каждой профессии с 2024 по 2034 год. На Рисунке 4 мы сравниваем нашу меру покрытия на уровне профессий с их прогнозами.
A regression at the occupation level weighted by current employment finds that growth projections are somewhat weaker for jobs with more observed exposure. For every 10 percentage point increase in coverage, the BLS’s growth projection drops by 0.6 percentage points. This provides some validation in that our measures track the independently derived estimates from labor market analysts, although the relationship is slight. Interestingly, there is no such correlation using the Eloundou et al. measure alone.
Регрессия на уровне профессий с весом по текущей занятости показывает, что прогнозы роста несколько слабее для профессий с более высокой observed exposure. На каждые 10 процентных пунктов увеличения покрытия прогноз роста BLS снижается на 0,6 процентных пункта. Это даёт некоторое подтверждение тому, что наши меры согласуются с независимо полученными оценками аналитиков рынка труда, хотя связь и слабая. Интересно, что подобной корреляции для одной только меры Eloundou et al. нет.
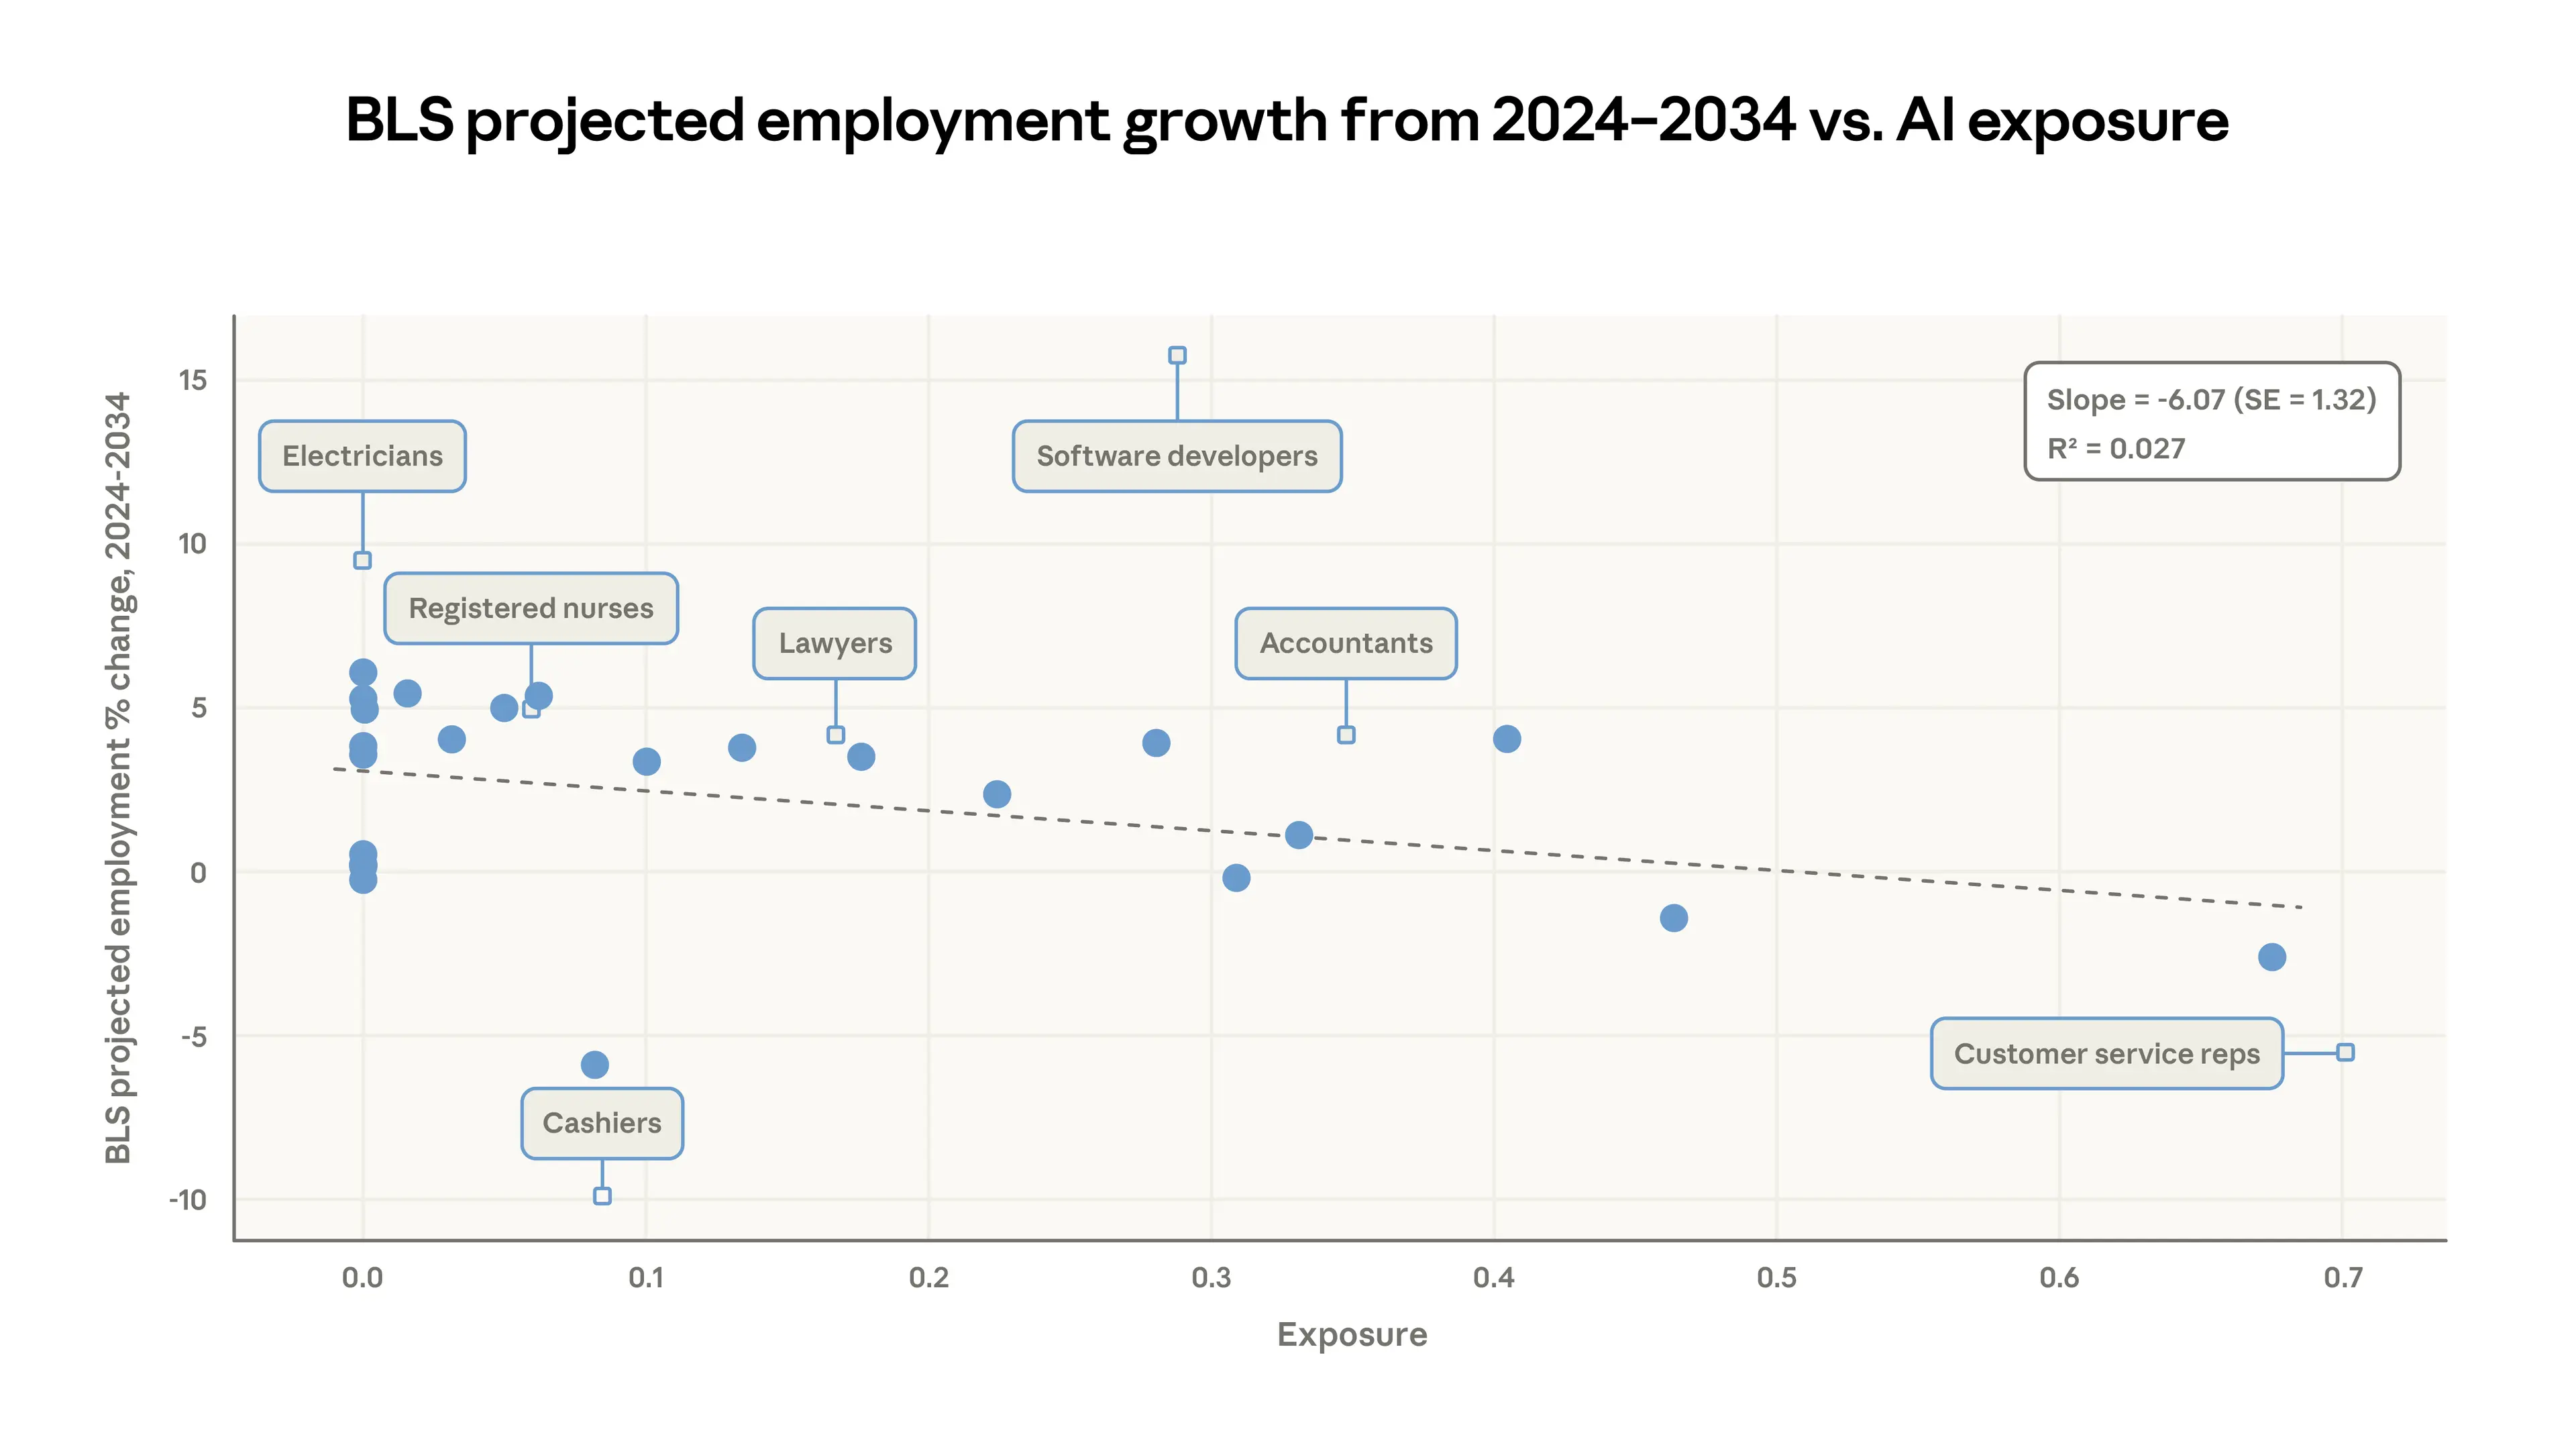
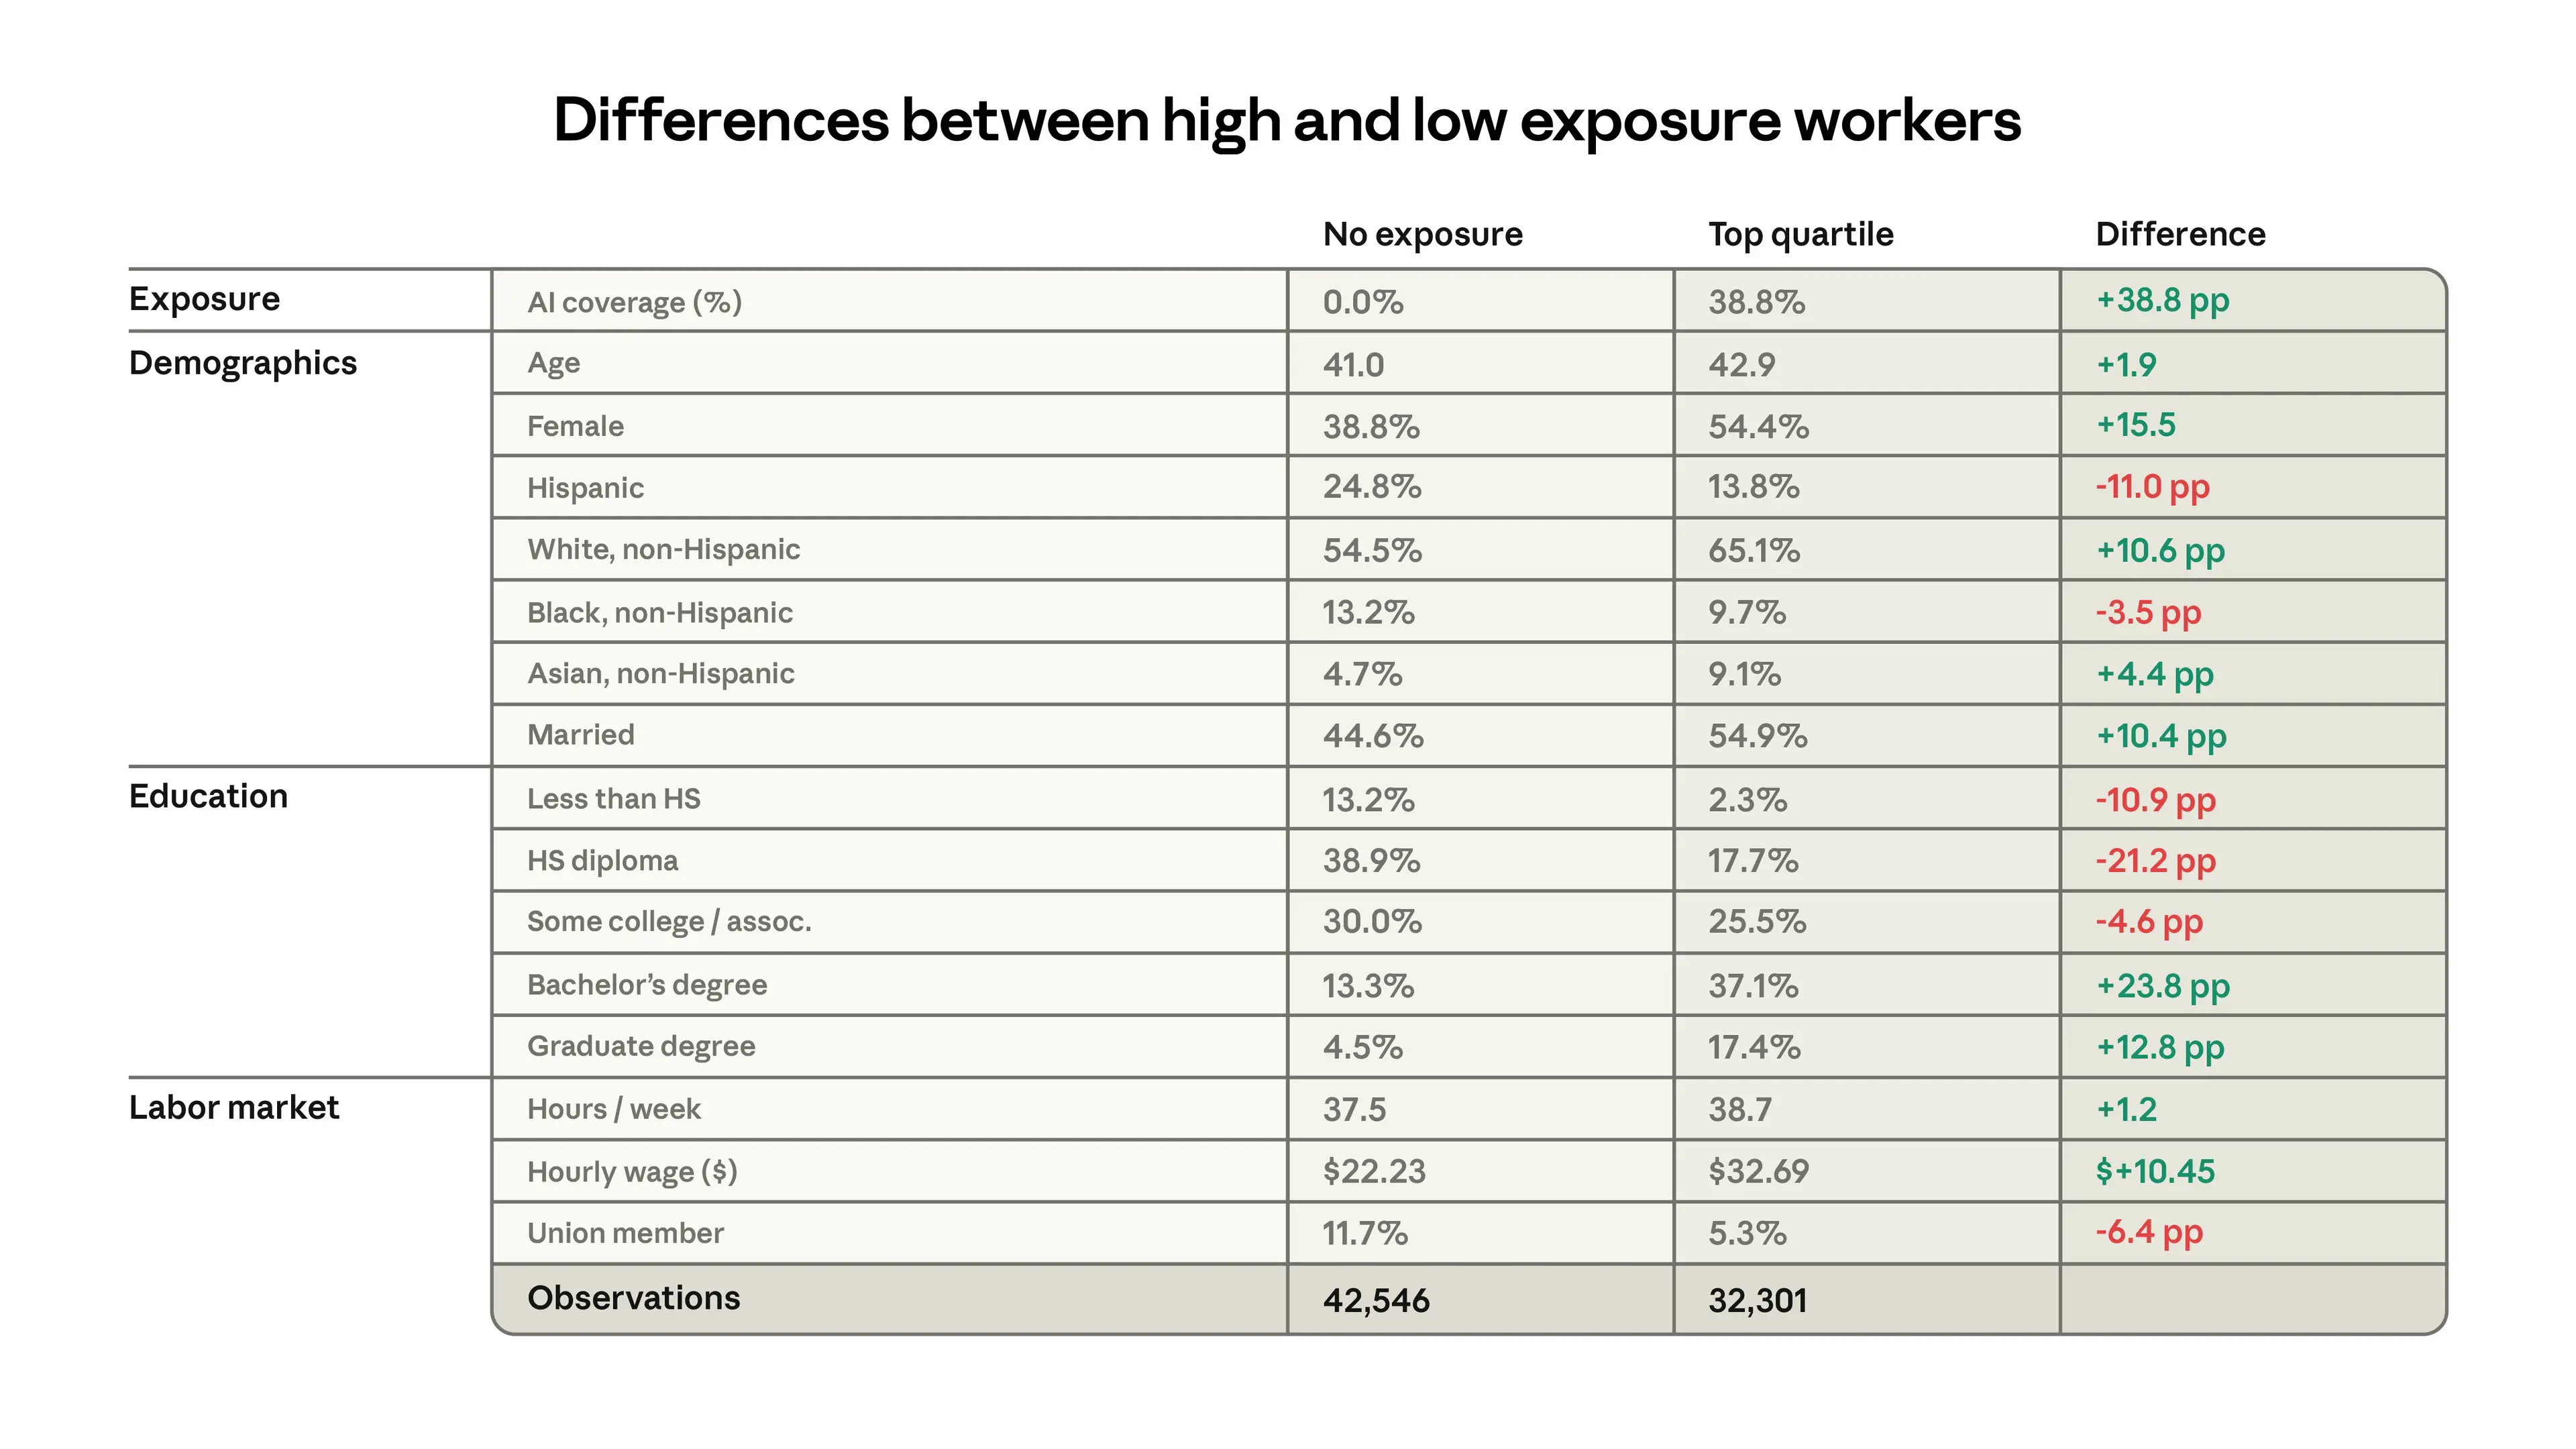
Figure 5 shows characteristics of workers in the top quartile of exposure and the 30% of workers with zero exposure in the three months before ChatGPT was released, August to October 2022, using data from the Current Population Survey.7 The groups are very different. The more exposed group is 16 percentage points more likely to be female, 11 percentage points more likely to be white, and almost twice as likely to be Asian. They earn 47% more, on average, and have higher levels of education. For example, people with graduate degrees are 4.5% of the unexposed group, but 17.4% of the most exposed group, an almost fourfold difference.
Рисунок 5 показывает характеристики работников в верхнем квартиле подверженности и 30% работников с нулевой подверженностью за три месяца до выпуска ChatGPT, с августа по октябрь 2022 года, на основе данных Current Population Survey.7 Эти группы очень различны. Более подверженная группа на 16 процентных пунктов чаще состоит из женщин, на 11 процентных пунктов чаще — из белых и почти вдвое чаще — из азиатов. Они зарабатывают в среднем на 47% больше и имеют более высокий уровень образования. Например, люди с учёной степенью составляют 4,5% неподверженной группы, но 17,4% наиболее подверженной — почти четырёхкратная разница.
Prioritizing outcomes
Приоритизация результатов
With these exposure measures in hand, the question is what to look for. Researchers have taken different approaches. For example, Gimbel et al. (2025) track changes in the occupational mix using the Current Population Survey. Their argument is that any important restructuring of the economy from AI would show up as changes in distribution of jobs.¹ (They find that, so far, changes have been unremarkable.) Brynjolfsson et al. (2025) look at employment levels split by age group using data from the payroll processing firm ADP, while Acemoglu et al. (2022) and Hampole et al. (2025) use job posting data from Burning Glass (now Lightcast) and Revelio, respectively.
Имея в руках эти меры подверженности, вопрос в том, на что смотреть. Исследователи использовали разные подходы. Например, Gimbel et al. (2025) отслеживают изменения в составе профессий с помощью Current Population Survey. Их аргумент в том, что любая значимая перестройка экономики из-за AI должна проявиться как изменения в распределении рабочих мест.¹ (Они обнаруживают, что пока изменения непримечательны.) Brynjolfsson et al. (2025) рассматривают уровень занятости в разбивке по возрастным группам с использованием данных компании по обработке зарплат ADP, тогда как Acemoglu et al. (2022) и Hampole et al. (2025) используют данные о вакансиях из Burning Glass (теперь Lightcast) и Revelio соответственно.
We focus on unemployment as our priority outcome because it most directly captures the potential for economic harm—a worker who is unemployed wants a job and has not yet found one. In this case, job postings and employment do not necessarily signal the need for policy responses; a decline in job postings for a highly exposed role may be counteracted by increased openings in a related one. Most harmful labor market developments of AI should arguably include a period of increased unemployment, as displaced workers search for alternatives. The Current Population Survey is well suited to tracking this, as unemployed respondents report their previous job and industry.
Мы фокусируемся на безработице как приоритетном показателе, поскольку она наиболее напрямую отражает потенциал экономического вреда: безработный человек хочет работу и пока её не нашёл. В этом случае вакансии и занятость не обязательно сигнализируют о необходимости политических реакций; снижение числа вакансий по сильно подверженной роли может компенсироваться увеличением вакансий в смежной. Большинство вредных для рынка труда последствий AI, вероятно, должно включать период повышенной безработицы, пока вытесненные работники ищут альтернативы. Current Population Survey хорошо подходит для отслеживания этого, поскольку безработные респонденты сообщают о своей предыдущей работе и отрасли.
Initial results
Первые результаты
We next study trends in unemployment, matching our occupation-level measures to respondents in the Current Population Survey.
Далее мы изучаем тренды безработицы, сопоставляя наши меры на уровне профессий с респондентами Current Population Survey.
A key question in interpreting our coverage measure is which workers should be considered treated? Should changes in employment be expected from just 10% task coverage? Gans and Goldfarb (2025) show that if an O-ring model best describes jobs, employment effects might be seen only when all tasks have some degree of AI penetration. Hampole et al. (2025) argue that mean exposure decreases labor demand, but concentration of exposure in only certain tasks can counteract this. And Autor and Thompson (2025) highlight the level of expertise required for the remaining tasks.
Ключевой вопрос при интерпретации нашей меры покрытия — каких работников считать «обработанными» воздействием? Следует ли ожидать изменений занятости уже при покрытии задач всего на 10%? Gans и Goldfarb (2025) показывают, что если профессии лучше описываются моделью O-ring, эффекты на занятость могут проявиться только тогда, когда все задачи имеют определённую степень проникновения AI. Hampole et al. (2025) утверждают, что средняя подверженность снижает спрос на труд, но концентрация подверженности только в определённых задачах может это компенсировать. А Autor и Thompson (2025) подчёркивают уровень экспертизы, требуемый для оставшихся задач.
With an eye toward simplicity, and noting that we are most concerned with large impacts, we center our analysis on the idea that impacts should be felt most in the groups with the highest mean exposure. We compare workers in the top quartile of time-weighted task coverage to those in the bottom. If AI capabilities advance quickly, task coverage might be high for lower percentiles of coverage, which might make an absolute threshold more helpful. But we make the assumption that impacts should affect the most exposed workers first, and present results varying the cutoff we use to define treatment.
Стремясь к простоте и отмечая, что нас больше всего волнуют крупные эффекты, мы строим анализ вокруг идеи о том, что воздействие должно ощущаться сильнее всего в группах с самой высокой средней подверженностью. Мы сравниваем работников в верхнем квартиле взвешенного по времени покрытия задач с работниками в нижнем. Если возможности AI растут быстро, покрытие задач может быть высоким и для более низких процентилей покрытия, и тогда более полезным может оказаться абсолютный порог. Но мы исходим из предположения, что воздействие должно затрагивать наиболее подверженных работников в первую очередь, и приводим результаты с варьированием порога, используемого для определения «обработанной» группы.
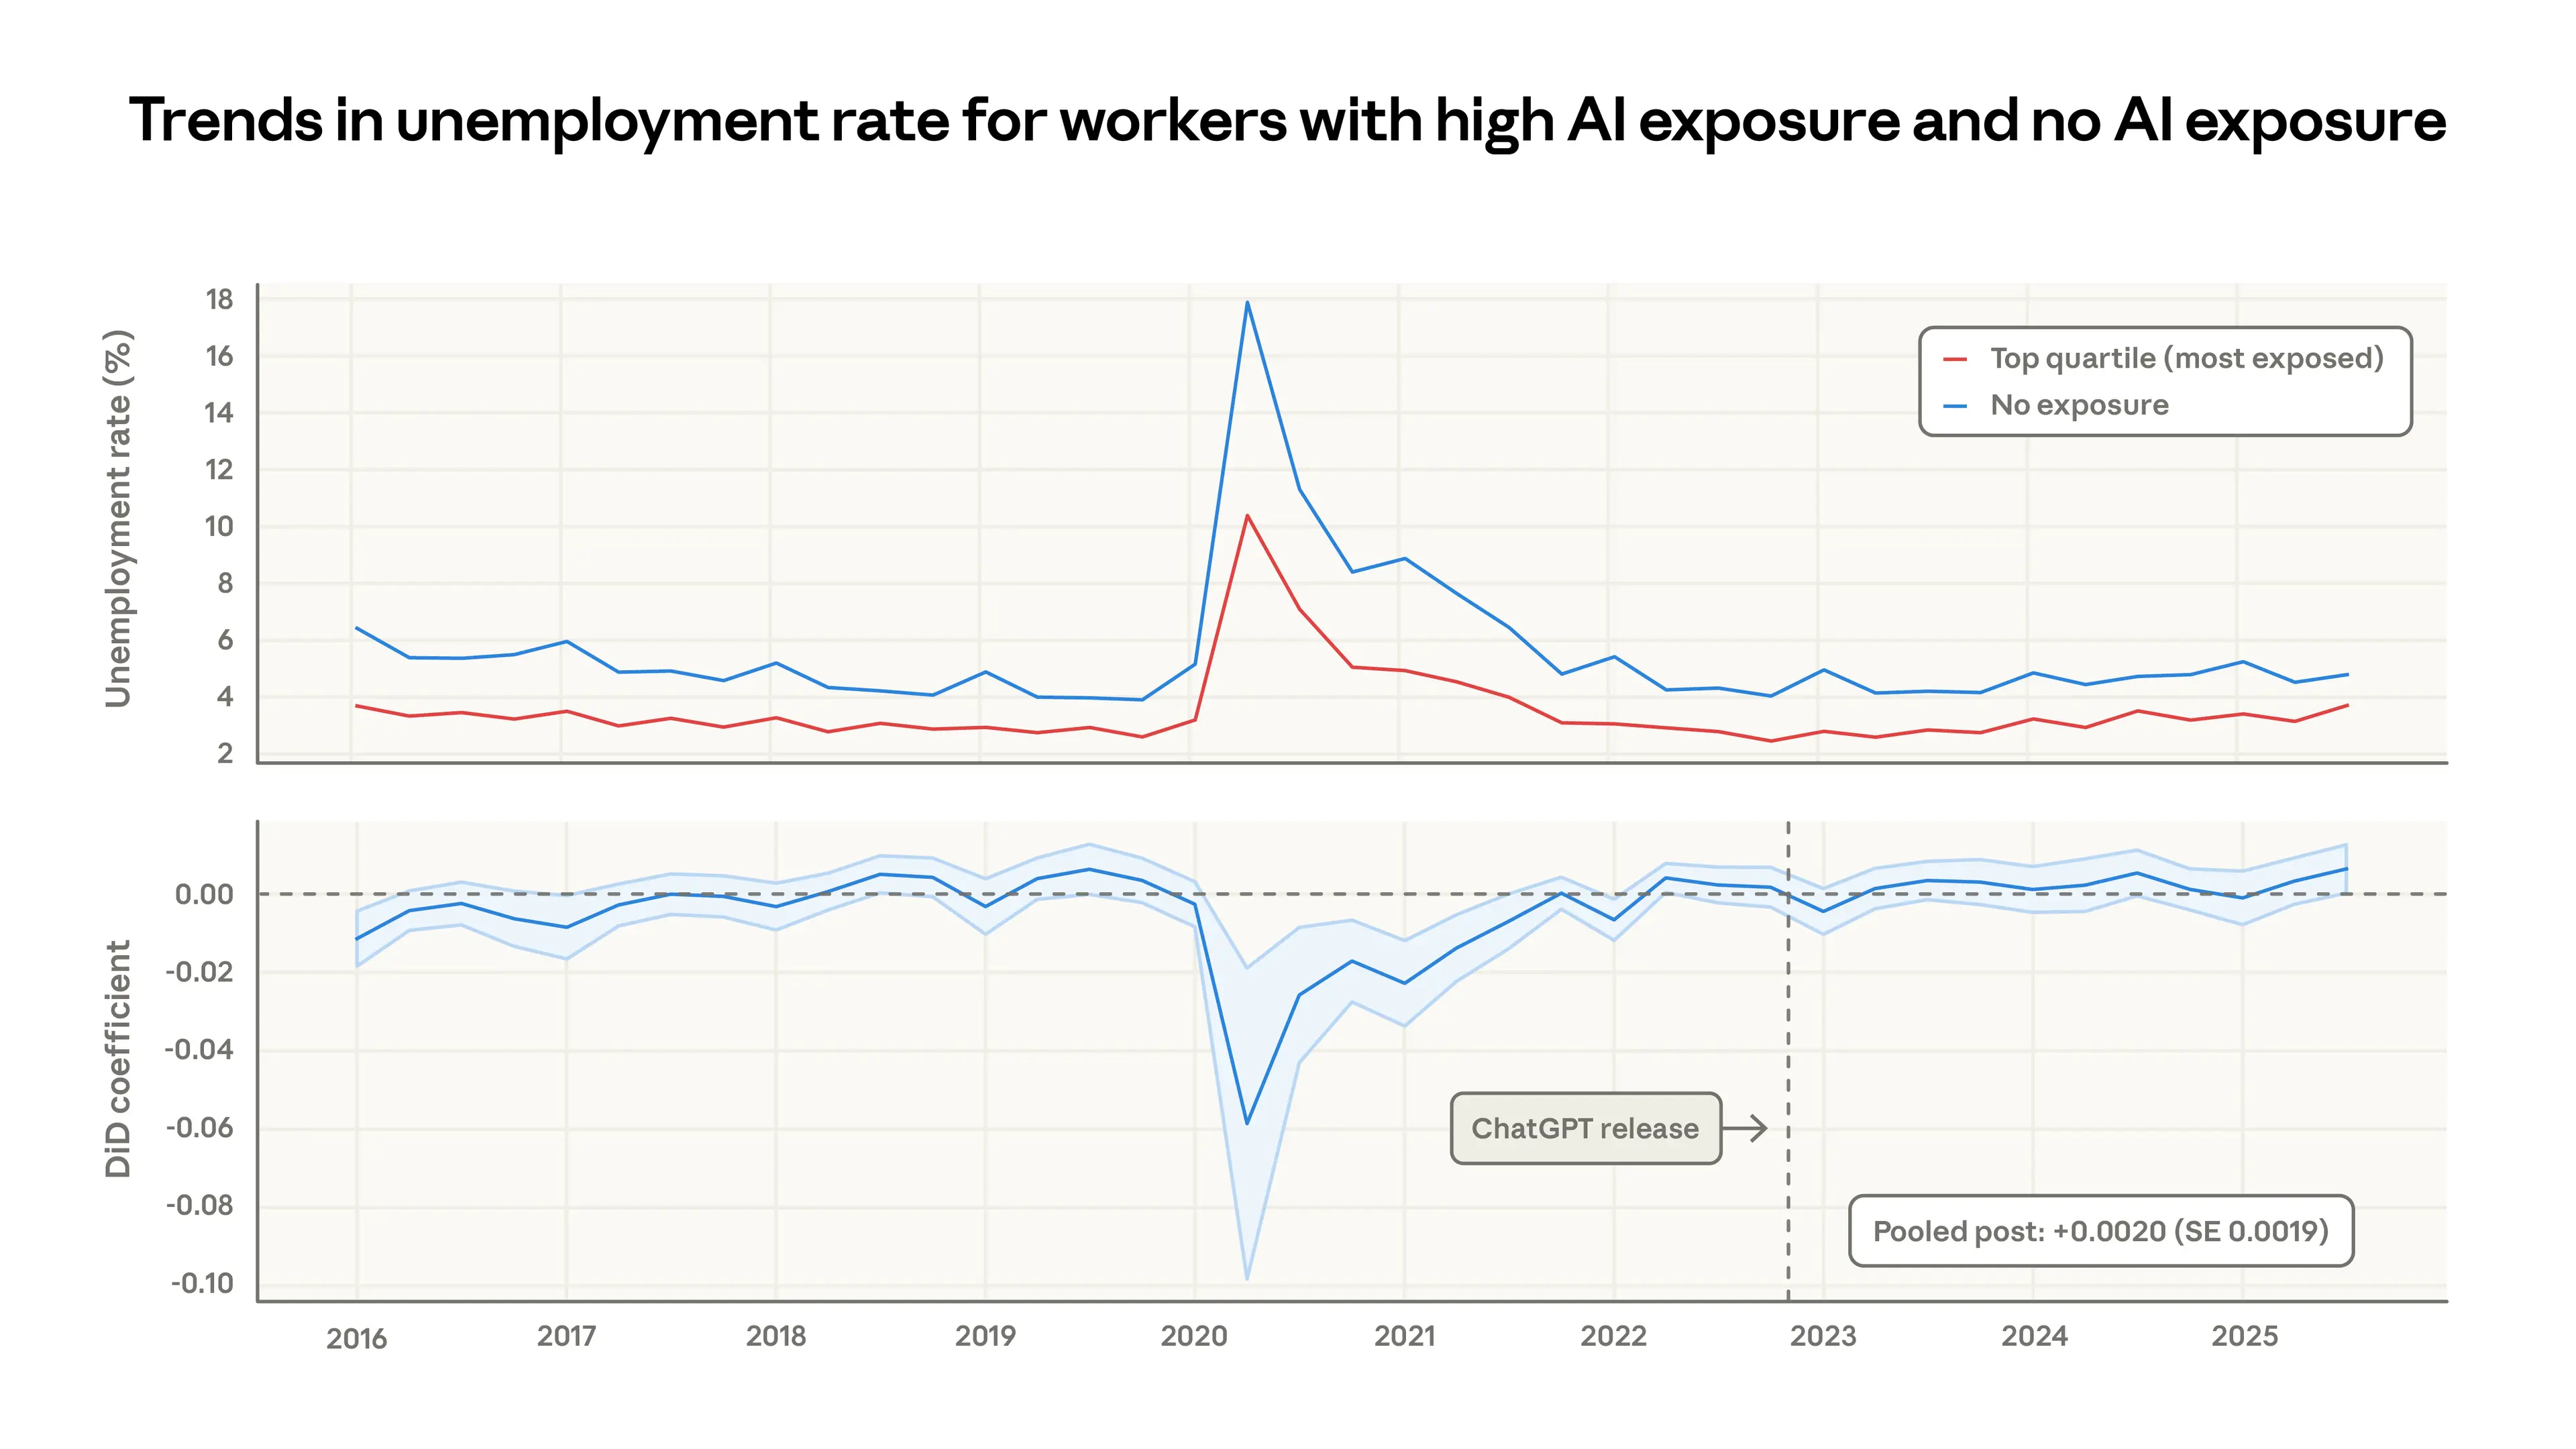
The upper panel of Figure 6 shows raw trends in the unemployment rate since 2016 for workers in the top quartile of exposure and the unexposed group. During COVID, the less AI-exposed workers—who are more likely to have in-person jobs—saw a much larger increase in unemployment. Since then, the trends have been largely similar between the two groups. The lower panel measures the size of the gap between the most and least exposed workers in a difference-in-differences framework, mirroring the findings from the raw data. The average change in the gap since the release of ChatGPT is small and insignificant, suggesting that the unemployment rate of the more exposed group has increased slightly but the effect is indistinguishable from zero.8
Верхняя панель Рисунка 6 показывает сырые тренды уровня безработицы с 2016 года для работников в верхнем квартиле подверженности и для неподверженной группы. Во время COVID менее подверженные AI работники — которые чаще имеют очную работу — испытали гораздо больший рост безработицы. С тех пор тренды между двумя группами были в основном похожи. Нижняя панель измеряет величину разрыва между наиболее и наименее подверженными работниками в рамках difference-in-differences, повторяя выводы из сырых данных. Среднее изменение разрыва с момента выпуска ChatGPT мало и незначимо, что указывает на то, что уровень безработицы более подверженной группы несколько вырос, но эффект неотличим от нуля.8
What kind of scenarios can this framework identify? Based on the confidence interval of the pooled estimate, differential increases in unemployment on the order of 1 percentage point would be detectable (this will change as new data comes in, so it is merely a ballpark estimate). If all workers within the top 10% were laid off, it would increase unemployment within the top quartile group from 3% to 43%, and it would increase aggregate unemployment from 4% to 13%.
Какие сценарии может выявить эта система? Исходя из доверительного интервала объединённой оценки, дифференциальные приросты безработицы порядка 1 процентного пункта были бы заметны (это будет меняться по мере поступления новых данных, так что это лишь приблизительная оценка). Если бы все работники в верхних 10% были уволены, безработица внутри группы верхнего квартиля выросла бы с 3% до 43%, а агрегированная безработица — с 4% до 13%.
A smaller but still concerning impact would be a scenario such as a “Great Recession for white-collar workers.” During the 2007-2009 Great Recession, unemployment rates doubled from 5% to 10% in the US. Such a doubling in the top quartile of exposure would increase its unemployment rate from 3% to 6%. This should be visible in our analysis as well. Note that our core estimate is based on differential changes in the unemployment rate in the exposed group compared to the less exposed group. If unemployment increased for all workers in parallel, we would not attribute this to AI advancements that still leave many tasks unaffected.
Меньшее, но всё же тревожное воздействие — это сценарий вроде «Великой рецессии для офисных работников». Во время Великой рецессии 2007–2009 годов уровень безработицы в США удвоился с 5% до 10%. Такое удвоение в верхнем квартиле подверженности подняло бы уровень безработицы в нём с 3% до 6%. Это также было бы видно в нашем анализе. Обратите внимание, что наша основная оценка основана на дифференциальных изменениях уровня безработицы в подверженной группе по сравнению с менее подверженной. Если бы безработица росла у всех работников параллельно, мы не приписывали бы это успехам AI, которые всё ещё не затрагивают многие задачи.
One group of particular concern is young workers. Brynjolfsson et al. report a 6—16% fall in employment in exposed occupations among workers aged 22 to 25. They attribute this decrease primarily to a slowdown in hiring rather than an increase in separations.9
Одна особенно тревожная группа — молодые работники. Brynjolfsson et al. сообщают о падении занятости в подверженных профессиях на 6–16% среди работников 22–25 лет. Они связывают это снижение в основном с замедлением найма, а не ростом увольнений.9
We find that the unemployment rate for young workers in the exposed occupations is flat (see Appendix). But slowed hiring may not necessarily manifest as increased unemployment, since many young workers are labor market entrants without a listed occupation in the CPS data and may exit the labor force rather than appear as unemployed. To address hiring directly, we use the panel dimension of the CPS, counting the percent of young (22-25 year old) workers who begin a new job in a more vs. less exposed occupation over time. Figure 7 shows the monthly job finding rate (i.e., when a worker reports a job that they did not have in the previous month) for young workers, split by whether they are entering a high- vs. low-exposure occupation.
Мы обнаруживаем, что уровень безработицы молодых работников в подверженных профессиях стабилен (см. Приложение). Но замедление найма не обязательно проявится как рост безработицы, поскольку многие молодые работники — это новички на рынке труда без указанной профессии в данных CPS, и они могут выйти из рабочей силы, не оказавшись в категории безработных. Чтобы напрямую обратиться к найму, мы используем панельное измерение CPS, считая процент молодых работников (22–25 лет), начинающих новую работу в более или менее подверженной профессии с течением времени. Рисунок 7 показывает месячный темп нахождения работы (то есть когда работник сообщает о работе, которой у него не было в предыдущем месяце) для молодых работников, в разбивке по тому, входят ли они в профессию с высокой или низкой подверженностью.
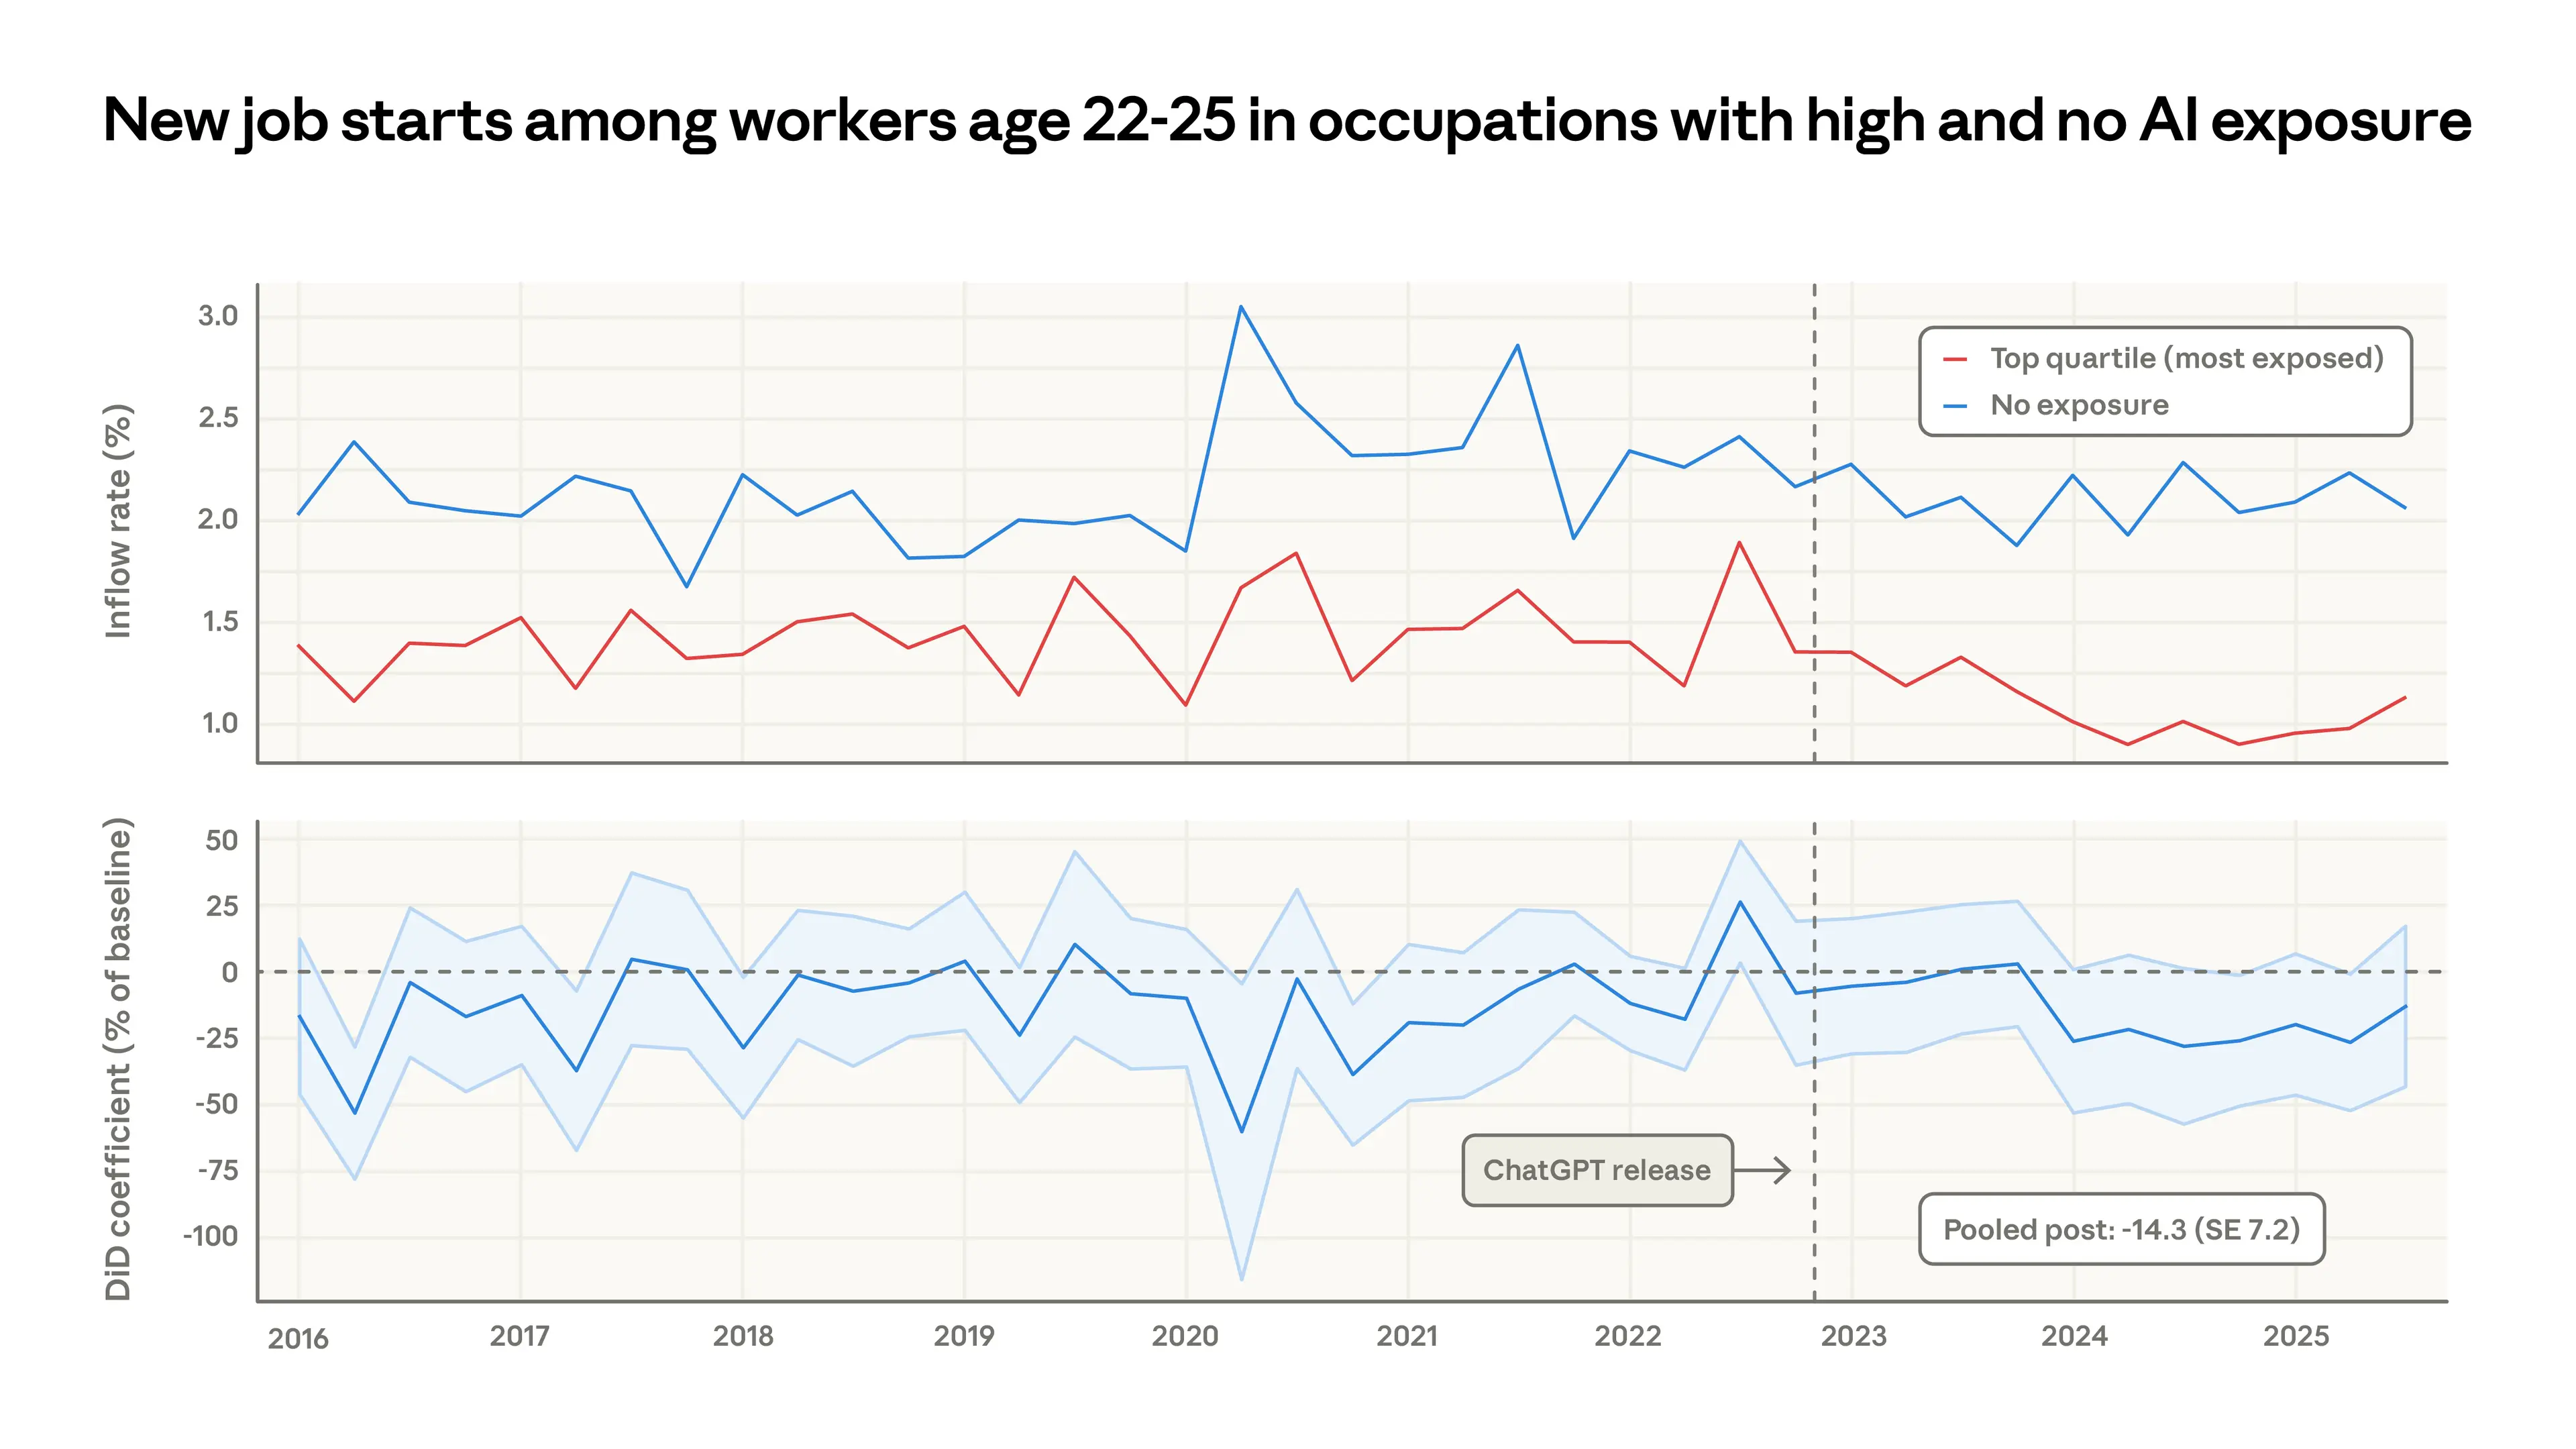
Apart from some large swings in 2020-2021, these series visually diverge in 2024, with young workers relatively less likely to be hired into exposed occupations. Job finding rates at the less exposed occupations remain stable at 2% per month, while entry into the most exposed jobs decreases by about half a percentage point. The averaged estimate in the post-ChatGPT era is a 14% drop in the job finding rate compared to that in 2022 in the exposed occupations, although this is just barely statistically significant. (There is no such decrease for workers older than 25.)
За исключением некоторых крупных колебаний в 2020–2021 годах, эти ряды визуально расходятся в 2024 году: молодые работники относительно реже устраиваются в подверженные профессии. Темпы найма в менее подверженных профессиях остаются стабильными на уровне 2% в месяц, тогда как вход в наиболее подверженные снижается примерно на полпроцентного пункта. Усреднённая оценка для эпохи после ChatGPT — снижение темпа нахождения работы на 14% по сравнению с 2022 годом в подверженных профессиях, хотя это лишь едва статистически значимо. (Для работников старше 25 лет такого снижения нет.)
This may provide some signal of the early effects of AI on employment, and echoes the findings from Brynjolfsson et al. But there are several alternative interpretations. The young workers who are not hired may be remaining at their existing jobs, taking different jobs, or returning to school. A further data-related caveat is that job transitions may be more vulnerable to mismeasurement in surveys.10
Это может давать определённый сигнал о ранних эффектах AI на занятость и перекликается с выводами Brynjolfsson et al. Но есть несколько альтернативных интерпретаций. Молодые работники, которые не были наняты, могут оставаться на своих текущих работах, переходить на другие работы или возвращаться к учёбе. Дополнительная оговорка, связанная с данными, заключается в том, что переходы между работами могут быть более уязвимы к ошибкам измерения в опросах.10
Discussion
Обсуждение
This report introduces a new measure for understanding the labor market effects of AI and studies impacts on unemployment and hiring. Jobs are more exposed to AI to the extent that their tasks are theoretically feasible with LLMs and observed on our platforms in automated, work-related use cases. We find that computer programmers, customer service representatives, and financial analysts are among the most exposed. Using survey data from the US, we find no impact on unemployment rates for workers in the most exposed occupations, although there’s tentative evidence that hiring into those professions has slowed slightly for workers aged 22-25.
Этот отчёт вводит новую меру для понимания эффектов AI на рынок труда и изучает воздействие на безработицу и наём. Профессии тем более подвержены AI, чем больше их задач теоретически осуществимы с LLM и наблюдаются на наших платформах в автоматизированных, связанных с работой сценариях использования. Мы обнаруживаем, что компьютерные программисты, представители клиентской поддержки и финансовые аналитики оказываются среди наиболее подверженных. Используя данные опросов в США, мы не находим воздействия на уровни безработицы для работников в наиболее подверженных профессиях, хотя есть предварительные свидетельства того, что наём в эти профессии немного замедлился для работников 22–25 лет.
Our work is a first step toward cataloging the impact of AI on the labor market. We hope that the analytical steps taken in this report, especially around coverage and counterfactuals, will be easy to update as new data on employment and AI usage emerge. An established approach may help future observers separate signal from noise.
Наша работа — первый шаг к систематизации влияния AI на рынок труда. Мы надеемся, что аналитические шаги, предпринятые в этом отчёте, особенно в части покрытия и контрфактуалов, будут легко обновляемы по мере появления новых данных о занятости и использовании AI. Устоявшийся подход может помочь будущим наблюдателям отделять сигнал от шума.
There are several improvements to be made to the present work. Our usage data will be incorporated in future updates, forming an evolving picture of task and job coverage in the economy. The Eloundou et al. metric could also be updated, to the extent that it is linked to LLM capabilities as of early 2023. And, given the suggestive results around young workers and labor market entrants, a key next step might be to look at how recent graduates with educational credentials in exposed areas are navigating the labor market.
В нынешней работе есть несколько улучшений, которые можно внести. Наши данные об использовании будут учитываться в будущих обновлениях, формируя развивающуюся картину покрытия задач и профессий в экономике. Метрика Eloundou et al. также может быть обновлена, поскольку она связана с возможностями LLM по состоянию на начало 2023 года. И, учитывая предварительные результаты по молодым работникам и новичкам на рынке труда, ключевым следующим шагом может быть изучение того, как недавние выпускники с образованием в подверженных областях ориентируются на рынке труда.
Appendix
Приложение
Acknowledgements
Благодарности
Written by Maxim Massenkoff and Peter McCrory.
Авторы: Maxim Massenkoff и Peter McCrory.
With acknowledgements to: Ruth Appel, Tim Belonax, Keir Bradwell, Andy Braden, Dexter Callender III, Miriam Chaum, Madison Clark, Jake Eaton, Deep Ganguli, Kunal Handa, Ryan Heller, Lara Karadogan, Jennifer Martinez, Jared Mueller, Sarah Pollack, David Saunders, Carl De Torres, Kim Withee, and Jack Clark.
С благодарностями: Ruth Appel, Tim Belonax, Keir Bradwell, Andy Braden, Dexter Callender III, Miriam Chaum, Madison Clark, Jake Eaton, Deep Ganguli, Kunal Handa, Ryan Heller, Lara Karadogan, Jennifer Martinez, Jared Mueller, Sarah Pollack, David Saunders, Carl De Torres, Kim Withee и Jack Clark.
We additionally thank Martha Gimbel, Anders Humlum, Evan Rose, and Nathan Wilmers for feedback on earlier versions of this report.
Также благодарим Martha Gimbel, Anders Humlum, Evan Rose и Nathan Wilmers за отзывы на ранние версии этого отчёта.
Citation
Цитирование
@online{massenkoffmccrory2026labor, author = {Maxim Massenkoff and Peter McCrory}, title = {Labor market impacts of AI: A new measure and early evidence}, date = {2026-03-05}, year = {2026}, url = {https://www.anthropic.com/research/labor-market-impacts}, }
@online{massenkoffmccrory2026labor, author = {Maxim Massenkoff and Peter McCrory}, title = {Labor market impacts of AI: A new measure and early evidence}, date = {2026-03-05}, year = {2026}, url = {https://www.anthropic.com/research/labor-market-impacts}, }
References
Ссылки
Acemoglu, Daron and Pascual Restrepo, "Robots and Jobs: Evidence from US Labor Markets," Journal of Political Economy, 2020, 128 (6), 2188–2244.
Acemoglu, Daron and Pascual Restrepo, "Robots and Jobs: Evidence from US Labor Markets," Journal of Political Economy, 2020, 128 (6), 2188–2244.
Acemoglu, Daron, David Autor, Jonathon Hazell, and Pascual Restrepo, "Artificial intelligence and jobs: Evidence from online vacancies," Journal of Labor Economics, 2022, 40 (S1), S293–S340.
Acemoglu, Daron, David Autor, Jonathon Hazell, and Pascual Restrepo, "Artificial intelligence and jobs: Evidence from online vacancies," Journal of Labor Economics, 2022, 40 (S1), S293–S340.
Appel, Ruth, Maxim Massenkoff, Peter McCrory, Miles McCain, Ryan Heller, Tyler Neylon, and Alex Tamkin, "Anthropic Economic Index report: economic primitives," 2026.
Appel, Ruth, Maxim Massenkoff, Peter McCrory, Miles McCain, Ryan Heller, Tyler Neylon, and Alex Tamkin, "Anthropic Economic Index report: economic primitives," 2026.
Autor, David H, David Dorn, and Gordon H Hanson, "The China syndrome: Local labor market effects of import competition in the United States," American Economic Review, 2013, 103 (6), 2121–2168.
Autor, David H, David Dorn, and Gordon H Hanson, "The China syndrome: Local labor market effects of import competition in the United States," American Economic Review, 2013, 103 (6), 2121–2168.
Autor, David H, & Thompson, N. (2025). Expertise. NBER Working Paper, (w33941).
Autor, David H, & Thompson, N. (2025). Expertise. NBER Working Paper, (w33941).
Blinder, Alan S et al., "How many US jobs might be offshorable?," World Economics, 2009, 10 (2), 41.
Blinder, Alan S et al., "How many US jobs might be offshorable?," World Economics, 2009, 10 (2), 41.
Borusyak, Kirill, Peter Hull, and Xavier Jaravel, "Quasi-experimental shift-share research designs," The Review of Economic Studies, 2022, 89 (1), 181–213.
Borusyak, Kirill, Peter Hull, and Xavier Jaravel, "Quasi-experimental shift-share research designs," The Review of Economic Studies, 2022, 89 (1), 181–213.
Brynjolfsson, Erik, Bharat Chandar, and Ruyu Chen, "Canaries in the coal mine? six facts about the recent employment effects of artificial intelligence," Digital Economy, 2025.
Brynjolfsson, Erik, Bharat Chandar, and Ruyu Chen, "Canaries in the coal mine? six facts about the recent employment effects of artificial intelligence," Digital Economy, 2025.
Eckhardt, Sarah and Nathan Goldschlag, "AI and Jobs: The Final Word (Until the Next One)," Economic Innovation Group (EIG), August 2025. Available at: https://eig.org/ai-and-jobs-the-final-word/
Eckhardt, Sarah and Nathan Goldschlag, "AI and Jobs: The Final Word (Until the Next One)," Economic Innovation Group (EIG), August 2025. Available at: https://eig.org/ai-and-jobs-the-final-word/
Eloundou, Tyna, Sam Manning, Pamela Mishkin, and Daniel Rock, "Gpts are gpts: An early look at the labor market impact potential of large language models," arXiv preprint arXiv:2303.10130, 2023, 10.
Eloundou, Tyna, Sam Manning, Pamela Mishkin, and Daniel Rock, "Gpts are gpts: An early look at the labor market impact potential of large language models," arXiv preprint arXiv:2303.10130, 2023, 10.
Fujita, S., Moscarini, G., & Postel-Vinay, F. (2024). Measuring employer-to-employer reallocation. American Economic Journal: Macroeconomics, 16(3), 1-51.
Fujita, S., Moscarini, G., & Postel-Vinay, F. (2024). Measuring employer-to-employer reallocation. American Economic Journal: Macroeconomics, 16(3), 1-51.
Gans, Joshua S. and Goldfarb, Avi, "O-Ring Automation," NBER Working Paper No. 34639, December 2025. Available at SSRN: https://ssrn.com/abstract=5962594
Gans, Joshua S. and Goldfarb, Avi, "O-Ring Automation," NBER Working Paper No. 34639, December 2025. Available at SSRN: https://ssrn.com/abstract=5962594
Gimbel, Martha, Molly Kinder, Joshua Kendall, and Maddie Lee, "Evaluating the Impact of AI on the Labor Market: Current State of Affairs," Research Report, The Budget Lab at Yale, New Haven, CT October 2025. Available at: https://budgetlab.yale.edu.
Gimbel, Martha, Molly Kinder, Joshua Kendall, and Maddie Lee, "Evaluating the Impact of AI on the Labor Market: Current State of Affairs," Research Report, The Budget Lab at Yale, New Haven, CT October 2025. Available at: https://budgetlab.yale.edu.
Graetz, Georg and Guy Michaels, "Robots at Work," Review of Economics and Statistics, 2018, 100 (5), 753–768.
Graetz, Georg and Guy Michaels, "Robots at Work," Review of Economics and Statistics, 2018, 100 (5), 753–768.
Hampole, Menaka, Dimitris Papanikolaou, Lawrence DW Schmidt, and Bryan Seegmiller, "Artificial intelligence and the labor market," Technical Report, National Bureau of Economic Research 2025.
Hampole, Menaka, Dimitris Papanikolaou, Lawrence DW Schmidt, and Bryan Seegmiller, "Artificial intelligence and the labor market," Technical Report, National Bureau of Economic Research 2025.
Handa, Kunal, Alex Tamkin, Miles McCain, Saffron Huang, Esin Durmus, Sarah Heck, Jared Mueller, Jerry Hong, Stuart Ritchie, Tim Belonax, Kevin K. Troy, Dario Amodei, Jared Kaplan, Jack Clark, and Deep Ganguli, "Which Economic Tasks are Performed with AI? Evidence from Millions of Claude Conversations," 2025.
Handa, Kunal, Alex Tamkin, Miles McCain, Saffron Huang, Esin Durmus, Sarah Heck, Jared Mueller, Jerry Hong, Stuart Ritchie, Tim Belonax, Kevin K. Troy, Dario Amodei, Jared Kaplan, Jack Clark, and Deep Ganguli, "Which Economic Tasks are Performed with AI? Evidence from Millions of Claude Conversations," 2025.
Hui, Xiang, Oren Reshef, and Luofeng Zhou, "The short-term effects of generative artificial intelligence on employment: Evidence from an online labor market," Organization Science, 2024, 35 (6), 1977–1989.
Hui, Xiang, Oren Reshef, and Luofeng Zhou, "The short-term effects of generative artificial intelligence on employment: Evidence from an online labor market," Organization Science, 2024, 35 (6), 1977–1989.
Johnston, Andrew and Christos Makridis, "The labor market effects of generative AI: A difference-in-differences analysis of AI exposure," Available at SSRN 5375017, 2025.
Johnston, Andrew and Christos Makridis, "The labor market effects of generative AI: A difference-in-differences analysis of AI exposure," Available at SSRN 5375017, 2025.
Massenkoff, Maxim, "How predictable is job destruction? Evidence from the Occupational Outlook," 2025. Working Paper.
Massenkoff, Maxim, "How predictable is job destruction? Evidence from the Occupational Outlook," 2025. Working Paper.
Ozimek, Adam, "Overboard on Offshore Fears," 2019. https://papers.ssrn.com/sol3/papers.cfm?abstract_id=3777307
Ozimek, Adam, "Overboard on Offshore Fears," 2019. https://papers.ssrn.com/sol3/papers.cfm?abstract_id=3777307
Tamkin, Alex and Peter McCrory, "Estimating AI productivity gains from Claude conversations," 2025.
Tamkin, Alex and Peter McCrory, "Estimating AI productivity gains from Claude conversations," 2025.
Tomlinson, K., Jaffe, S., Wang, W., Counts, S., & Suri, S. (2025). Working with AI: measuring the applicability of generative AI to occupations. arXiv preprint arXiv:2507.07935.
Tomlinson, K., Jaffe, S., Wang, W., Counts, S., & Suri, S. (2025). Working with AI: measuring the applicability of generative AI to occupations. arXiv preprint arXiv:2507.07935.
Footnotes
Сноски
Job offshorability: Blinder et al. (2009) and Ozimek (2019); Government growth forecasts: Massenkoff (2025); Robots: Graetz and Michaels (2018) and Acemoglu and Restrepo (2020); China shock: Autor et al. (2013) and Borusyak et al. (2022).
Brynjolfsson et al. (2025) compare employment trends for workers in more versus less AI-exposed occupations, using the task exposure measures from Eloundou et al. (2023) and payroll data from ADP. Johnston and Makridis (2025) do a similar task-based analysis using US administrative data, but they aggregate treatment to the industry level. Hui et al. (2024) study how freelance jobs on Upwork responded to the release of ChatGPT and advanced image generation tools, comparing workers in directly affected categories to those in unaffected categories before and after each tool's release date. Hampole et al. (2025) instrument for firm-level AI adoption using historical university hiring networks: firms that historically recruited from universities whose graduates later entered AI-related roles faced lower adoption costs.
Our task- and occupation-level exposure measures can readily incorporate other usage data, and be extended to different countries. We intend to apply this methodology to new settings over time.
In their framework, “Directly exposed'” tasks were those that could be completed in half the time with an LLM (with a 2,000-word input limit and no access to recent facts). Tasks that were “exposed with tools” were those subject to the same speedup with an LLM that had access to software for, e.g., information retrieval and image processing. Tasks that were not exposed could not have their duration reduced by 50% or more using an LLM.
We use the previous two Anthropic Economic Index datasets, covering usage from August and November 2025. For ONET tasks that are highly semantically similar, we split the counts across them.
There are judgment calls involved at every step. Should the Eloundou et al. (2023) measure enter as {0, 0.5, 1} or something else? What determines "significant" use? How do we handle tasks which seem very similar to those with high usage, but are too rare to have been picked up specifically in the sampling for the Economic Index? How much more should automation workflows count compared to augmentation? A reassuring finding which we expand on in the Appendix is that the Spearman (rank-rank) correlation of job exposure across many resolutions to these questions is exceedingly high.
To match O*NET-SOC codes to occ1990 codes in the CPS, we use the crosswalk provided by Eckhart and Goldschlag (2025).
We explore this further in three ways in the Appendix. First, we ask whether the percentile cutoff that we use to define treatment matters, varying it from the median to the 95th percentile. In all cases, the impact is flat or negative (meaning that unemployment decreases for the exposed group). Next, we focus on young workers in particular, those aged 22 to 25 as in Brynjolfsson et al. (2025). Finally, we use data on unemployment insurance claimants from the Department of Labor to measure the unemployment, rather than CPS survey responses. In no extension do we find clear impacts on exposed jobs.
This range is wide because the authors provide estimates against multiple counterfactuals. The 6 percentage point drop compares to a counterfactual of flat employment growth. The 16 percentage point estimate comes from a design comparing similar workers in the same firm with different occupations.
See Fujita, et al. (2024).
Возможность вынесения рабочих мест за рубеж: Blinder et al. (2009) и Ozimek (2019); Государственные прогнозы роста: Massenkoff (2025); Роботы: Graetz и Michaels (2018) и Acemoglu и Restrepo (2020); Китайский шок: Autor et al. (2013) и Borusyak et al. (2022).Brynjolfsson et al. (2025) сравнивают тренды занятости работников в более и менее подверженных AI профессиях, используя меры подверженности задач из Eloundou et al. (2023) и данные о зарплатах от ADP. Johnston и Makridis (2025) проводят аналогичный анализ на основе задач с использованием административных данных США, но агрегируют воздействие до уровня отрасли. Hui et al. (2024) изучают, как фриланс-работы на Upwork отреагировали на выпуск ChatGPT и продвинутых инструментов генерации изображений, сравнивая работников в напрямую затронутых категориях с теми, кто не был затронут, до и после даты выпуска каждого инструмента. Hampole et al. (2025) используют инструментальную переменную для внедрения AI на уровне фирм, опирающуюся на исторические сети найма из университетов: фирмы, которые исторически набирали выпускников из университетов, чьи выпускники позже занимали роли, связанные с AI, сталкивались с более низкими издержками внедрения.Наши меры подверженности на уровне задач и профессий могут легко включать другие данные об использовании и распространяться на разные страны. Мы намерены применять эту методологию к новым контекстам со временем.В их системе «непосредственно подверженные» задачи — те, которые можно было выполнить вдвое быстрее с помощью LLM (с лимитом ввода 2000 слов и без доступа к недавним фактам). Задачи, «подверженные с инструментами», — те, которые подвергались такому же ускорению с LLM, имеющей доступ к ПО, например, для информационного поиска и обработки изображений. Задачи, которые не были подвержены, не могли быть сокращены по продолжительности на 50% или более с помощью LLM.Мы используем два предыдущих набора данных Anthropic Economic Index, охватывающих использование за август и ноябрь 2025 года. Для задач ONET, семантически очень близких друг к другу, мы делим счётчики между ними.На каждом шаге задействованы оценочные суждения. Должна ли мера Eloundou et al. (2023) входить как {0, 0,5, 1} или как-то иначе? Что определяет «значительное» использование? Как мы обращаемся с задачами, которые кажутся очень похожими на задачи с высоким использованием, но слишком редки, чтобы быть конкретно подхваченными в выборке для Economic Index? Насколько большее значение следует придавать сценариям автоматизации по сравнению с дополнением? Обнадёживающий вывод, на котором мы подробнее останавливаемся в Приложении, состоит в том, что корреляция Спирмена (по рангам) подверженности профессий при многих вариантах ответа на эти вопросы чрезвычайно высока.Чтобы сопоставить коды O*NET-SOC с кодами occ1990 в CPS, мы используем кросс-таблицу, предоставленную Eckhart and Goldschlag (2025).Мы исследуем это далее тремя способами в Приложении. Во-первых, мы спрашиваем, имеет ли значение процентильный порог, который мы используем для определения воздействия, варьируя его от медианы до 95-го процентиля. Во всех случаях эффект плоский или отрицательный (то есть безработица для подверженной группы снижается). Затем мы фокусируемся именно на молодых работниках, в возрасте 22–25 лет, как в Brynjolfsson et al. (2025). Наконец, мы используем данные о получателях пособий по безработице от Министерства труда для измерения безработицы вместо ответов на опрос CPS. Ни в одном расширении мы не находим явных эффектов на подверженные профессии.Этот диапазон широк, потому что авторы приводят оценки относительно нескольких контрфактуалов. Падение на 6 процентных пунктов сравнивается с контрфактуалом плоского роста занятости. Оценка в 16 процентных пунктов получена из дизайна, сравнивающего похожих работников в одной и той же фирме с разными профессиями.См. Fujita et al. (2024).
Corrections
Исправления
Updated Mar 8, 2026: Corrected Figure 7, which incorrectly reversed the labels between top quartile and zero exposure group inflow rates.
Обновлено 8 марта 2026: Исправлен Рисунок 7, на котором ошибочно поменялись местами подписи между темпами притока для группы верхнего квартиля и группы с нулевой подверженностью.
Related content
Связанные материалы
2028: Two scenarios for global AI leadership
2028: Два сценария глобального лидерства в AI
Our views on the AI competition between the US and China.
Наши взгляды на конкуренцию в области AI между США и Китаем.
Teaching Claude why
Обучая Claude «почему»
New research on how we've reduced agentic misalignment.
Новое исследование о том, как мы снизили агентскую рассогласованность.
Natural Language Autoencoders: Turning Claude’s thoughts into text
Natural Language Autoencoders: превращение мыслей Claude в текст
AI models like Claude talk in words but think in numbers. In this study we train Claude to translate its thoughts into human-readable text.
AI-модели вроде Claude говорят словами, но думают числами. В этом исследовании мы обучаем Claude переводить свои мысли в читаемый человеком текст.